CGL 2026 Tier 1EzSSC Practice
Learn › Quantitative Aptitude

Statisticsसांख्यिकी

13 questions from all 53 shifts of SSC CGL Tier 1 2026 · Quant

⏱ Take a timed quiz on this topic

Tap an option to check your answer, or use “Show answer”. Switch to Hindi with the हिं button at the top.अंग्रेज़ी के लिए ऊपर EN बटन दबाएँ।
Q113 Oct 2026 05:00 PM (Shift-3) · Q75Bar Graph: Highest and Lowest Non-zero Frequencymoderate
figure
Answer: D
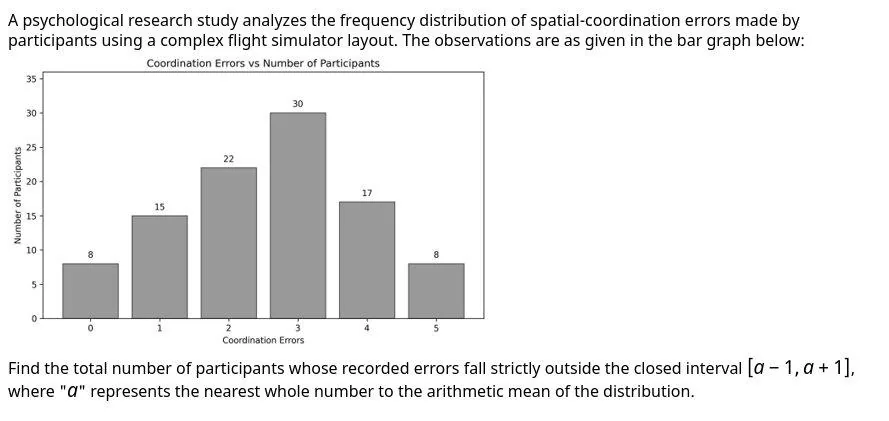
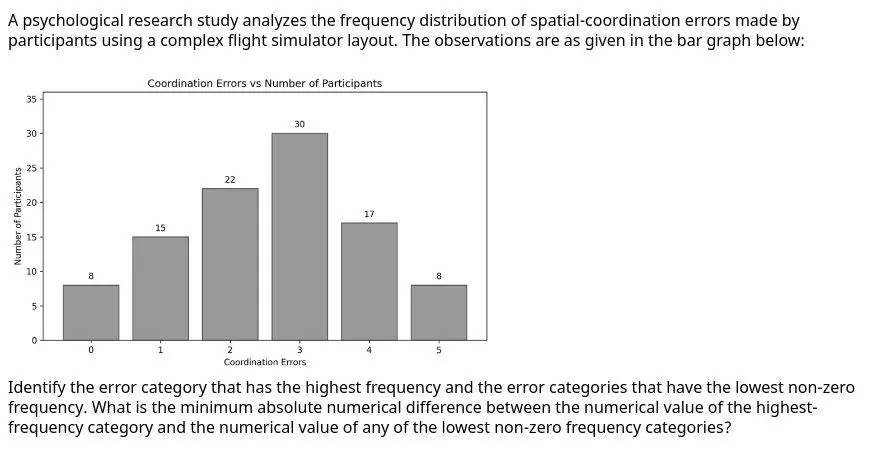
Bar heights: category 0 = 8, 1 = 15, 2 = 22, 3 = 30, 4 = 17, 5 = 8. Highest frequency is category 3 (30). Lowest non-zero frequency is 8, shared by categories 0 and 5. Differences: |3 - 0| = 3 and |3 - 5| = 2, so the minimum is 2,. Option D.
figure
उत्तर: D
बार की ऊँचाइयाँ: श्रेणी 0 = 8, 1 = 15, 2 = 22, 3 = 30, 4 = 17, 5 = 8। उच्चतम आवृत्ति श्रेणी 3 (30) है। न्यूनतम गैर-शून्य आवृत्ति 8 है, जो श्रेणी 0 और 5 की है। अंतर: |3 − 0| = 3 और |3 − 5| = 2, अतः न्यूनतम 2 है, जो विकल्प D है। विकल्प D।
🔗 Link
Q209 Oct 2026 10:00 AM (Shift-1) · Q51Frequency Polygoneasy
figure
Answer: B
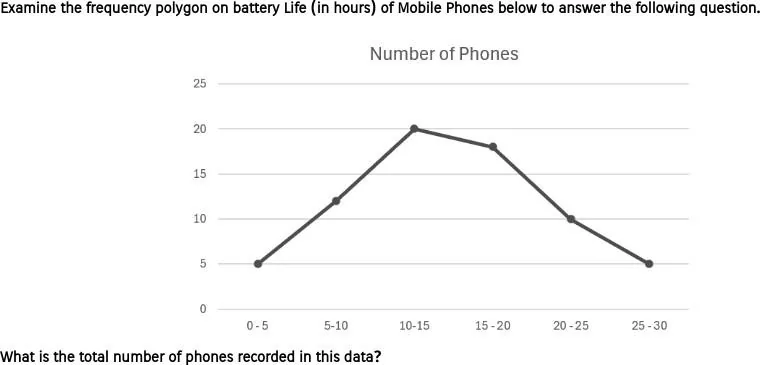
Read the frequency of each class from the polygon: 0-5 is 5, 5-10 is 12, 10-15 is 20, 15-20 is 18, 20-25 is 10 and 25-30 is 5. Total = 5 + 12 + 20 + 18 + 10 + 5 = 70. Answer: option B. Option B.
figure
उत्तर: B
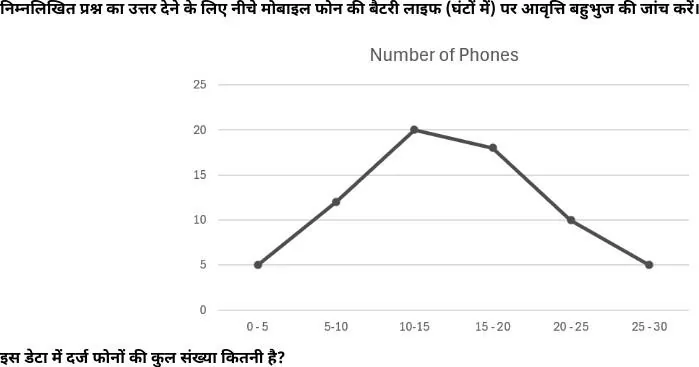
बहुभुज से हर वर्ग की आवृत्ति पढ़ें: 0-5 में 5, 5-10 में 12, 10-15 में 20, 15-20 में 18, 20-25 में 10 और 25-30 में 5। कुल = 5 + 12 + 20 + 18 + 10 + 5 = 70। उत्तर: विकल्प B।
🔗 Link
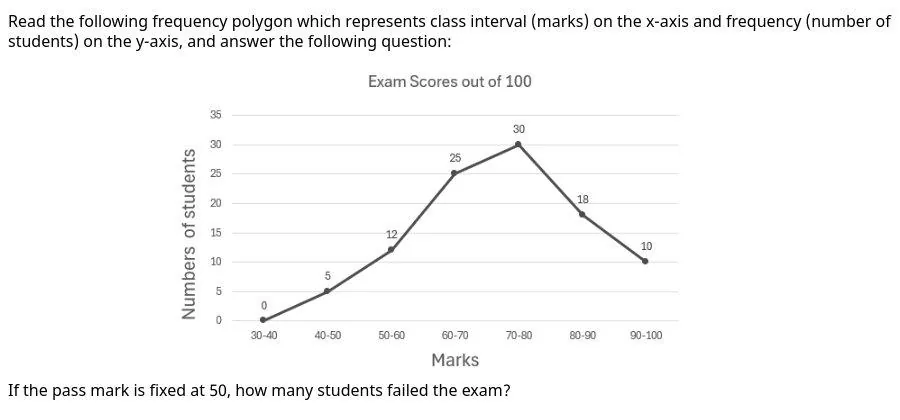
Q313 Oct 2026 05:00 PM (Shift-3) · Q65Frequency Polygon: Students Failingeasy
figure
Answer: B
Frequencies: 30-40: 0, 40-50: 5, 50-60: 12, 60-70: 25, 70-80: 30, 80-90: 18, 90-100: 10. Students below the pass mark of 50 are in the classes 30-40 and 40-50, so failures = 0 + 5 = 5,. Option B.
figure
उत्तर: B
बारंबारताएँ: 30-40: 0, 40-50: 5, 50-60: 12, 60-70: 25, 70-80: 30, 80-90: 18, 90-100: 10। पासिंग मार्क्स 50 से कम अंक वाले छात्र वर्ग 30-40 और 40-50 में हैं, अतः फेल छात्र = 0 + 5 = 5, जो विकल्प B है। विकल्प B।
🔗 Link
Q405 Oct 2026 05:00 PM (Shift-3) · Q68Histogram: Height of Barseasy
In a histogram, what does the height of each bar represent?
Answer: B
In a histogram the area of each bar is proportional to the frequency, and the height is the frequency density (frequency divided by class width). Option B is correct. Option A is the width of the bar, and option C is the midpoint of a class, which is not drawn as a height. Option B.
आयतचित्र में प्रत्येक बार की ऊंचाई क्या दर्शाती है?
उत्तर: B
आयतचित्र में प्रत्येक बार का क्षेत्रफल आवृत्ति के समानुपाती होता है, और ऊँचाई आवृत्ति घनत्व (आवृत्ति ÷ वर्ग की चौड़ाई) होती है। अतः विकल्प B सही है। विकल्प A बार की चौड़ाई है, और C वर्ग का मध्यबिंदु है, जो ऊँचाई नहीं दर्शाता। विकल्प B।
🔗 Link
Q510 Oct 2026 05:00 PM (Shift-3) · Q75Mean of Discrete Distributionhard
figure
Answer: A
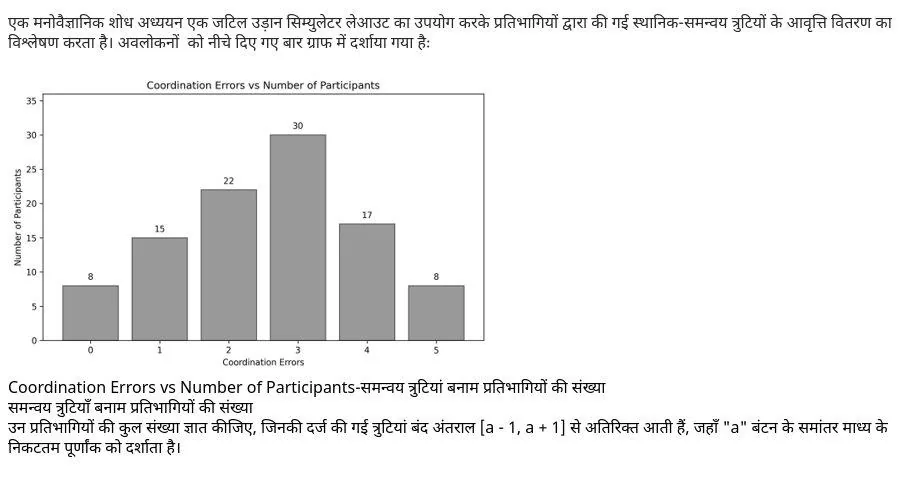
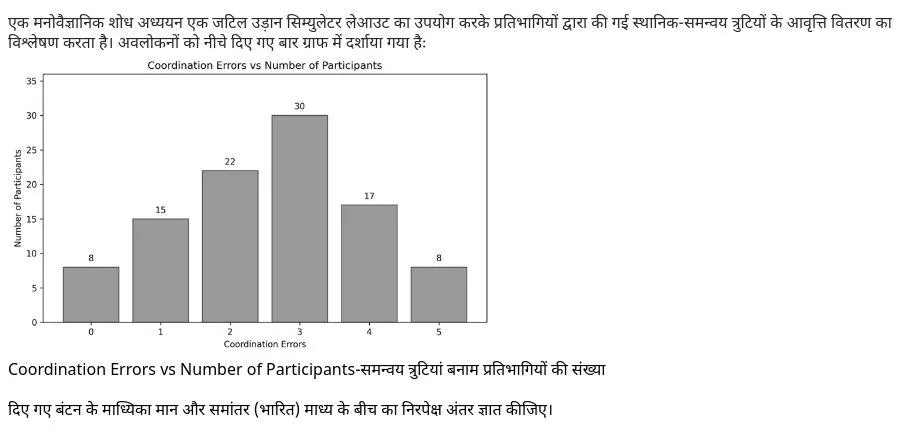
From the bar graph, errors 0, 1, 2, 3, 4, 5 have 8, 15, 22, 30, 17, 8 participants, a total of $N=100$. The sum of $x\times f$ is $0+15+44+90+68+40=257$, so the mean is $2.57$ and $a=3$. The closed interval is $[2,4]$, so the values outside it are 0, 1 and 5, giving $8+15+8=31$, which is. Option A.
figure
उत्तर: A
बार ग्राफ से त्रुटियों 0, 1, 2, 3, 4, 5 के लिए प्रतिभागी 8, 15, 22, 30, 17, 8 हैं, कुल $N=100$। $x\times f$ का योग $0+15+44+90+68+40=257$ है, अतः माध्य $2.57$ और $a=3$ है। बंद अंतराल $[2,4]$ है, अतः इसके बाहर के मान 0, 1 और 5 हैं, जिनका योग $8+15+8=31$ है, जो विकल्प A है। विकल्प A।
🔗 Link
Q622 Oct 2026 01:30 PM (Shift-2) · Q72Median and Mean of Discrete Distribution from Bar Graphmoderate
figure
Answer: B
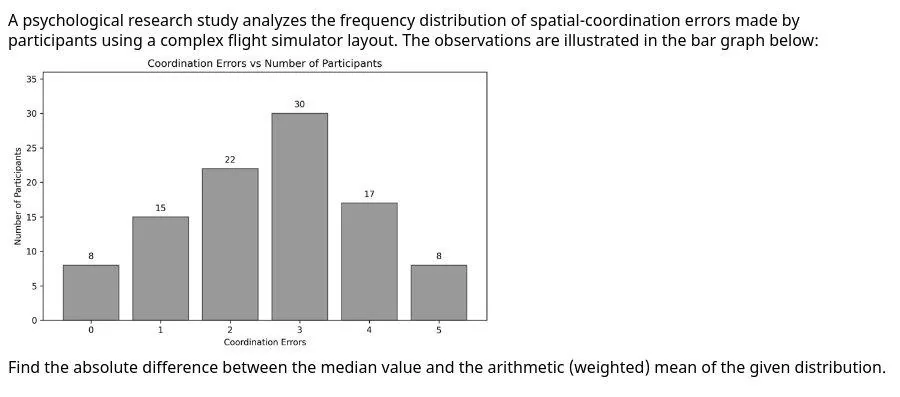
From the bar graph, the frequencies are: error 0: 8, error 1: 15, error 2: 22, error 3: 30, error 4: 17, error 5: 8. The total is $N=100$. Mean $=\frac{0\cdot8+1\cdot15+2\cdot22+3\cdot30+4\cdot17+5\cdot8}{100}=\frac{257}{100}=2.57$. Cumulative frequencies are 8, 23, 45, 75, so the 50th and 51st observations are both 3, and the median is 3. The absolute difference is $|3-2.57|=0.43$. Option B is correct. Option B.
figure
उत्तर: B
बार ग्राफ़ से आवृत्तियाँ हैं: त्रुटि 0: 8, त्रुटि 1: 15, त्रुटि 2: 22, त्रुटि 3: 30, त्रुटि 4: 17, त्रुटि 5: 8। कुल $N=100$ है। माध्य $=\frac{0\cdot8+1\cdot15+2\cdot22+3\cdot30+4\cdot17+5\cdot8}{100}=\frac{257}{100}=2.57$ है। संचयी आवृत्तियाँ 8, 23, 45, 75 हैं, अतः 50वाँ और 51वाँ प्रेक्षण दोनों 3 हैं और माध्यिका 3 है। निरपेक्ष अंतर $|3-2.57|=0.43$ है। सही उत्तर विकल्प B है। विकल्प B।
🔗 Link
Q706 Oct 2026 05:00 PM (Shift-3) · Q71Median Class from Histogrammoderate
figure
Answer: D
Frequencies: 55, 80, 108, 117, 150, 105, 70. Total N = 685, so N/2 = 342.5. Cumulative frequencies are 55, 135, 243, 360, ... The first cumulative frequency at or above 342.5 is 360, which belongs to the 180-190 class. Answer: D. Option D.
figure
उत्तर: D
आवृत्तियाँ: 55, 80, 108, 117, 150, 105, 70। कुल N = 685, अतः N/2 = 342.5। संचयी आवृत्तियाँ 55, 135, 243, 360, ... हैं। 342.5 के बराबर या उससे बड़ी पहली संचयी आवृत्ति 360 है, जो 180-190 वर्ग की है। उत्तर: D। विकल्प D।
🔗 Link
Q814 Oct 2026 10:00 AM (Shift-1) · Q68Median from Frequency Polygonhard
figure
Answer: B
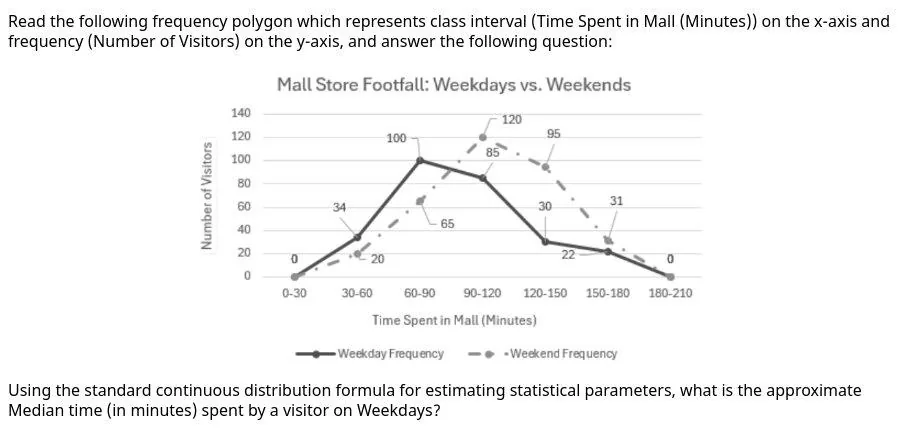
Weekday frequencies from the polygon are 0, 34, 100, 85, 30, 22, 0, total 271, so N/2 = 135.5. Cumulative frequency up to 60-90 is 134, so the median class is 90-120 with f = 85, F = 134 and h = 30. Median = 90 + ((135.5 - 134) / 85) x 30 = 90 + 0.53 = 90.5 minutes,. Option B.
figure
उत्तर: B
पॉलीगन से कार्य दिवस की आवृत्तियाँ 0, 34, 100, 85, 30, 22, 0 हैं; कुल = 271, अतः N/2 = 135.5। 60–90 तक संचयी आवृत्ति 134 है, इसलिए माध्यिका वर्ग 90–120 है (f = 85, F = 134, h = 30)। माध्यिका = 90 + ((135.5 − 134)/85) × 30 = 90 + 0.53 ≈ 90.5 मिनट। सही विकल्प B है। विकल्प B।
🔗 Link
Q922 Oct 2026 01:30 PM (Shift-2) · Q51Midpoint of Class Intervaleasy
figure
Answer: A
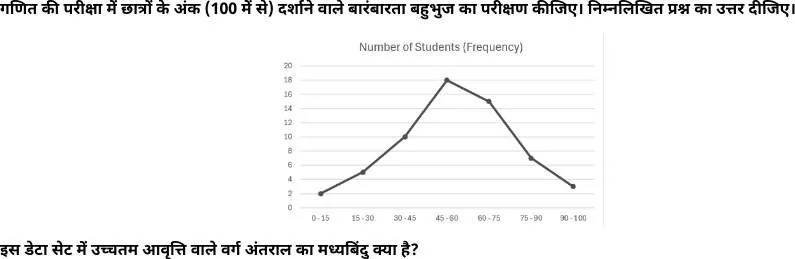
The frequency polygon peaks at 18 students for the class 45-60, which is the highest frequency. The midpoint of a class is $\frac{\text{lower limit}+\text{upper limit}}{2}=\frac{45+60}{2}=52.5$. So the answer is option A. Option B (52) is only a rounded value, while C (45.2) and D (60.5) are not the midpoint of any class here. Option A.
figure
उत्तर: A
सबसे अधिक बारंबारता 18 वर्ग अंतराल 45-60 की है। इस वर्ग का मध्यबिंदु $\frac{45+60}{2}=52.5$ है, अतः सही उत्तर विकल्प A है। विकल्प B (52) केवल एक पूर्णांकित मान है, जबकि C (45.2) और D (60.5) इस डेटा के किसी वर्ग के मध्यबिंदु नहीं हैं। विकल्प A।
🔗 Link
Q1006 Oct 2026 05:00 PM (Shift-3) · Q75Mode and Median of Discrete Dataeasy
figure
Answer: A
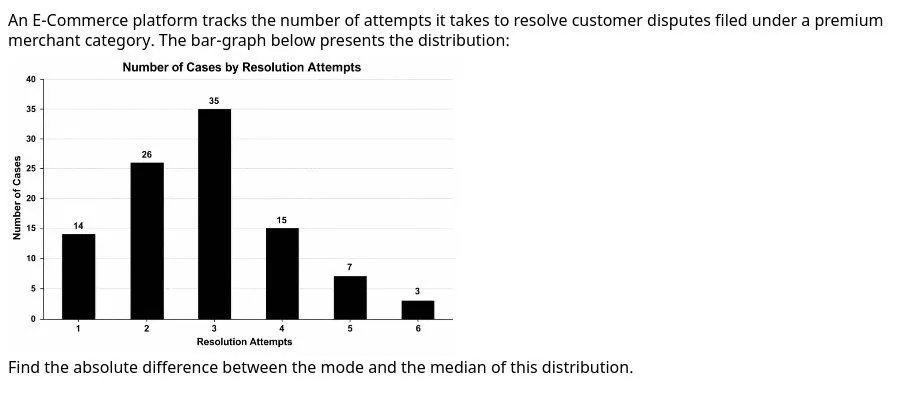
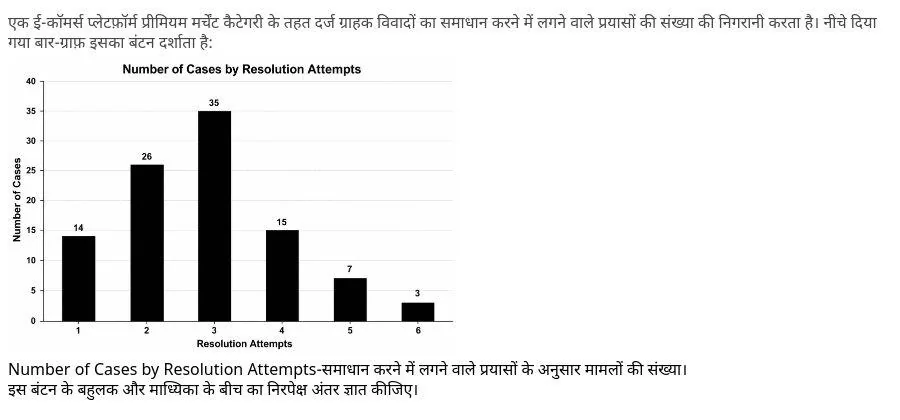
Frequencies by attempts: 1 → 14, 2 → 26, 3 → 35, 4 → 15, 5 → 7, 6 → 3. Total N = 100. Cumulative frequencies: 14, 40, 75, 90, 97, 100. The 50th and 51st values both fall in attempt 3, so the median is 3. The mode is also 3 (frequency 35). The absolute difference is 0. Answer: A. Option A.
figure
उत्तर: A
प्रयासों के अनुसार आवृत्तियाँ: 1 → 14, 2 → 26, 3 → 35, 4 → 15, 5 → 7, 6 → 3। कुल N = 100। संचयी आवृत्तियाँ 14, 40, 75, 90, 97, 100 हैं। 50वाँ और 51वाँ मान दोनों प्रयास 3 में आते हैं, अतः माध्यिका 3 है। बहुलक भी 3 है (आवृत्ति 35)। निरपेक्ष अंतर 0 है। उत्तर: A। विकल्प A।
🔗 Link
Q1114 Oct 2026 05:00 PM (Shift-3) · Q71Probability from Histogrammoderate
figure
Answer: B
Frequencies are 55, 80, 108, 117, 150, 105 and 70, so the total is 685. The modal class is 190-200 (highest frequency 150). Probability = 150 / 685 = 0.219, which rounds to 0.22. Answer:. Option B.
figure
उत्तर: B
आवृत्तियाँ 55, 80, 108, 117, 150, 105 और 70 हैं, अतः कुल = 685। बहुलक वर्ग 190-200 है (उच्चतम आवृत्ति 150)। प्रायिकता = 150 / 685 = 0.219, जो दो दशमलव तक 0.22 है। विकल्प B।
🔗 Link
Q1214 Oct 2026 05:00 PM (Shift-3) · Q72Probability from Pie Charteasy
figure
Answer: C
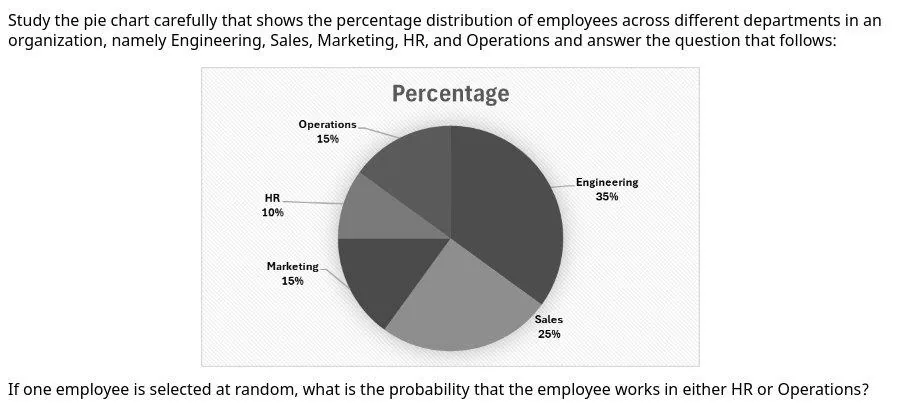
HR is 10% and Operations is 15%, so together they are 25% of employees. Probability = 0.25. Answer:. Option C.
figure
उत्तर: C
HR 10% और ऑपरेशन्स 15% हैं, अतः दोनों मिलकर कर्मचारियों का 25% हैं। प्रायिकता = 0.25। विकल्प C।
🔗 Link
Q1305 Oct 2026 05:00 PM (Shift-3) · Q75Reading a Histogrameasy
figure
Answer: B
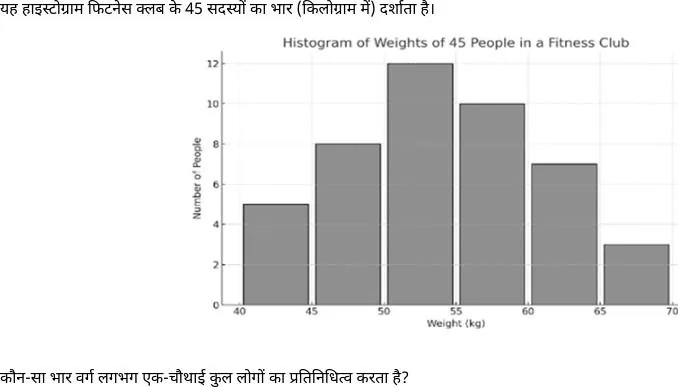
Frequencies from the histogram: 40-45 = 5, 45-50 = 8, 50-55 = 12, 55-60 = 10, 60-65 = 7, 65-70 = 3, total 45. One-fourth of 45 is 11.25, and the class 50-55 with 12 people is the closest. Option B is correct. Option B.
figure
उत्तर: B
आयतचित्र से आवृत्तियाँ: 40-45 = 5, 45-50 = 8, 50-55 = 12, 55-60 = 10, 60-65 = 7, 65-70 = 3, कुल 45। 45 का एक-चौथाई 11.25 है, और 12 लोगों वाला वर्ग 50-55 सबसे निकट है। अतः विकल्प B सही है। विकल्प B।
🔗 Link