CGL 2026 Tier 1EzSSC Practice
Learn › Quantitative Aptitude

Data Interpretationआँकड़ा निर्वचन

95 questions from all 53 shifts of SSC CGL Tier 1 2026 · Quant

⏱ Take a timed quiz on this topic

Tap an option to check your answer, or use “Show answer”. Switch to Hindi with the हिं button at the top.अंग्रेज़ी के लिए ऊपर EN बटन दबाएँ।
Q112 Oct 2026 05:00 PM (Shift-3) · Q57Average from Bar Graphmoderate
figure
Answer: A
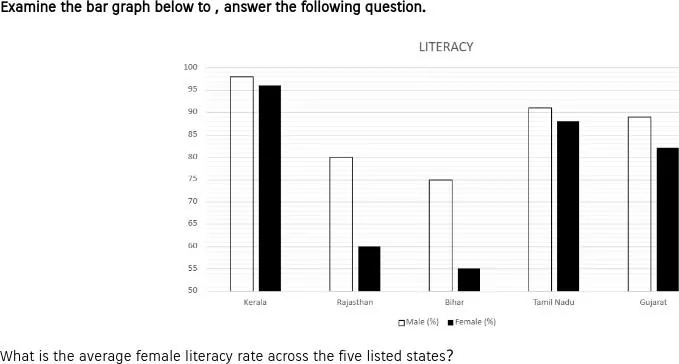
Female literacy bars read from the graph: Kerala about 96, Rajasthan about 60, Bihar about 55, Tamil Nadu about 88, Gujarat about 82. Sum = 381. Average = 381/5 = 76.2%. Answer: A. Option A.
figure
उत्तर: A
ग्राफ से महिला साक्षरता के बार लगभग: केरल 96, राजस्थान 60, बिहार 55, तमिलनाडु 88, गुजरात 82। योग = 381। औसत = 381/5 = 76.2%। उत्तर: A। विकल्प A।
🔗 Link
Q208 Oct 2026 05:00 PM (Shift-3) · Q65Bar Diagrameasy
A bar diagram shows the number of tourists visiting 5 tourist spots during 4 months. How many bars will the diagram contain?
Answer: B
This is a multiple (grouped) bar diagram with one bar for each tourist spot in each month: 5 spots × 4 months = 20 bars. Option B.
एक बार आरेख 4 महीनों के दौरान 5 पर्यटन स्थलों पर आने वाले पर्यटकों की संख्या दर्शाता है। आरेख में कितने बार होंगे?
उत्तर: B
यह बहु-दंड आरेख है, जिसमें हर महीने के लिए हर पर्यटन स्थल का एक दंड होता है: 5 स्थल × 4 महीने = 20 दंड। सही विकल्प B है। विकल्प B।
🔗 Link
Q305 Oct 2026 05:00 PM (Shift-3) · Q67Bar Diagram Accuracyeasy
When comparing unemployment rates across five states using a bar diagram, what is important to maintain for accuracy?
Answer: C
For an accurate comparison, all bars must be on one common scale and have equal width, so that the heights are directly comparable and width does not mislead the eye. Option C is correct. Option A and B break comparability, and option D changes only the colour, which does not affect accuracy. Option C.
बार आरेख का उपयोग करके पांच राज्यों में बेरोजगारी दर की तुलना करते समय, सटीकता के लिए क्या ध्यान रखना महत्वपूर्ण है?
उत्तर: C
सटीक तुलना के लिए सभी बार एक समान पैमाने पर और बराबर चौड़ाई के होने चाहिए, ताकि ऊँचाइयाँ सीधे तुलनीय हों। अतः विकल्प C सही है। विकल्प A और B तुलना को गलत बनाते हैं, और D केवल रंग बदलता है, सटीकता नहीं। विकल्प C।
🔗 Link
Q401 Oct 2026 05:00 PM (Shift-3) · Q57Bar Graphmoderate
figure
Answer: A
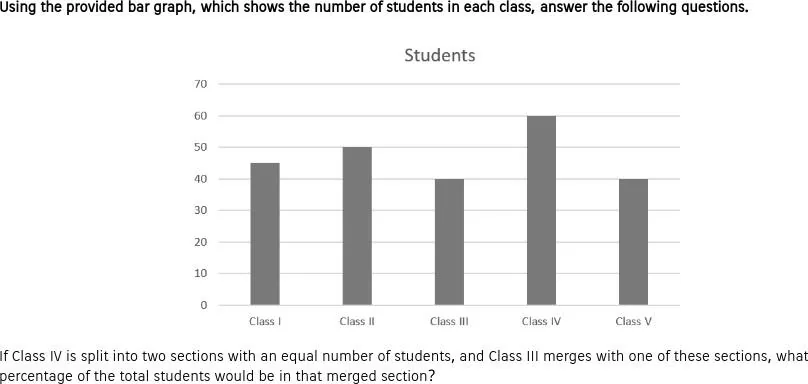
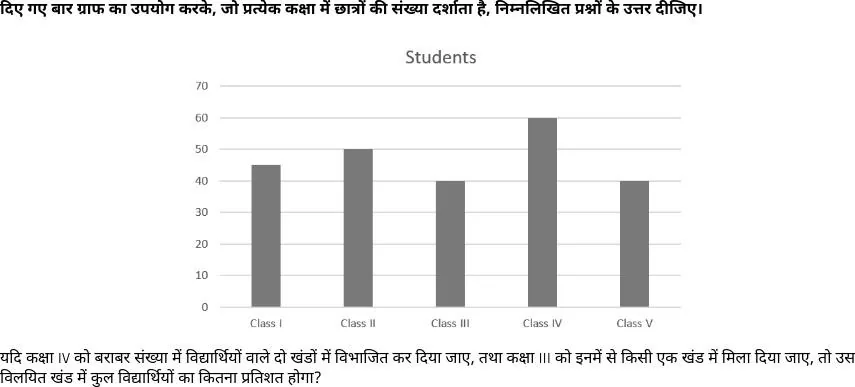
Class counts from the graph: I = 45, II = 50, III = 40, IV = 60, V = 40, total 235. Class IV splits into two sections of 30. Class III (40) merges with one section of 30, giving 70. Percentage $= \frac{70}{235} \times 100 \approx 29.8\%$, closest to 30%, option A. Option A.
figure
उत्तर: A
ग्राफ से कक्षाओं के छात्र: I = 45, II = 50, III = 40, IV = 60, V = 40, कुल 235। कक्षा IV के दो खंड 30-30 के हैं। कक्षा III (40) को एक खंड (30) में मिलाने पर 70 होते हैं। प्रतिशत $= \frac{70}{235} \times 100 \approx 29.8\%$ है, जो 30% के सबसे निकट है, अतः विकल्प A।
🔗 Link
Q501 Oct 2026 05:00 PM (Shift-3) · Q58Bar Graphmoderate
figure
Answer: A
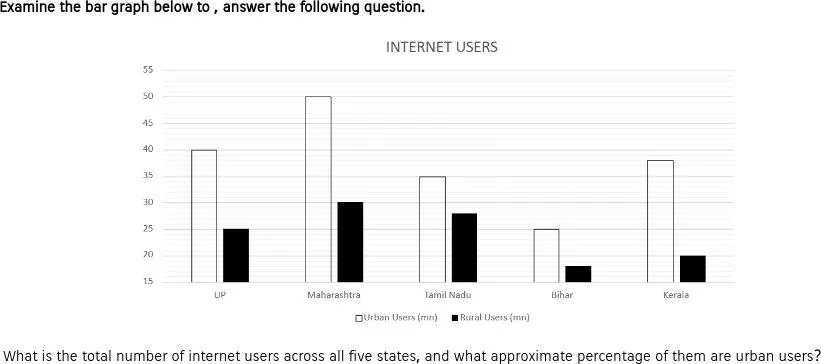
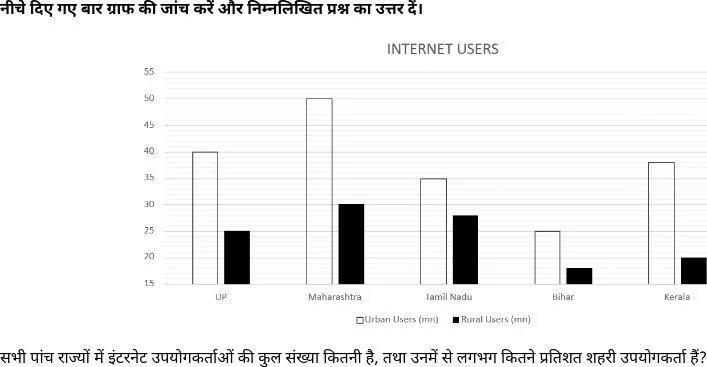
Reading the bars (urban, rural): UP 40, 25; Maharashtra 50, 30; Tamil Nadu 35, 28; Bihar 25, 18; Kerala 38, 20. State totals are 65, 80, 63, 43, 58, so the grand total is 309 million. Urban total is 40+50+35+25+38 = 188, and $188/309 \approx 60.8\%$, about 61%, option A. The axis starts at 15, not 0, so the bar tops must be read against the labelled scale. Option A.
figure
उत्तर: A
बार से पढ़े गए मान (शहरी, ग्रामीण): UP 40, 25; महाराष्ट्र 50, 30; तमिलनाडु 35, 28; बिहार 25, 18; केरल 38, 20 हैं। राज्यवार कुल 65, 80, 63, 43, 58 हैं, अतः कुल 309 मिलियन हैं। शहरी उपयोगकर्ता 188 हैं और $188/309 \approx 60.8\%$ है, यानी लगभग 61%, जो विकल्प A है। ग्राफ का अक्ष 0 से नहीं, 15 से शुरू होता है। विकल्प A।
🔗 Link
Q607 Oct 2026 05:00 PM (Shift-3) · Q56Bar Grapheasy
figure
Answer: C
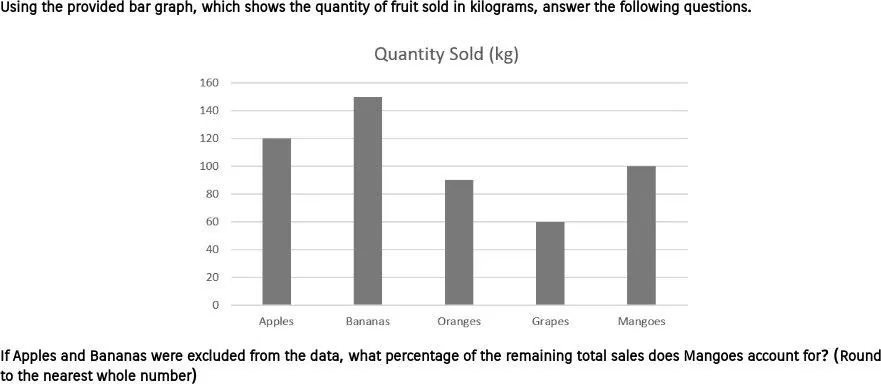
Bar values in kg: Apples 120, Bananas 150, Oranges 90, Grapes 60, Mangoes 100. Excluding Apples and Bananas leaves 90 + 60 + 100 = 250 kg. Mangoes share = $\frac{100}{250} \times 100 = 40\%$, which is option C. Option C.
figure
उत्तर: C
बार ग्राफ से मान (किलोग्राम में): सेब 120, केले 150, संतरे 90, अंगूर 60, आम 100। सेब और केले हटाने पर शेष 90 + 60 + 100 = 250 किलोग्राम है। आमों का हिस्सा $\frac{100}{250} \times 100 = 40\%$ है, जो विकल्प C है। विकल्प C।
🔗 Link
Q710 Oct 2026 01:30 PM (Shift-2) · Q74Bar Grapheasy
figure
Answer: B
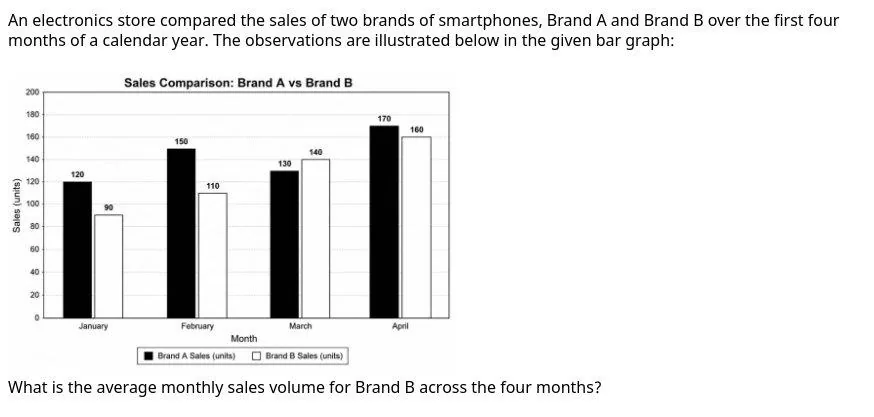
Brand B sales: January 90, February 110, March 140, April 160. Total = 500 units. Average = 500 / 4 = 125 units. Answer: B. Option B.
figure
उत्तर: B
ब्रांड B की बिक्री: जनवरी 90, फरवरी 110, मार्च 140, अप्रैल 160 इकाई। कुल = 500 इकाई। औसत = 500 / 4 = 125 इकाई। उत्तर: B। विकल्प B।
🔗 Link
Q823 Oct 2026 10:00 AM (Shift-1) · Q73Bar Grapheasy
figure
Answer: D
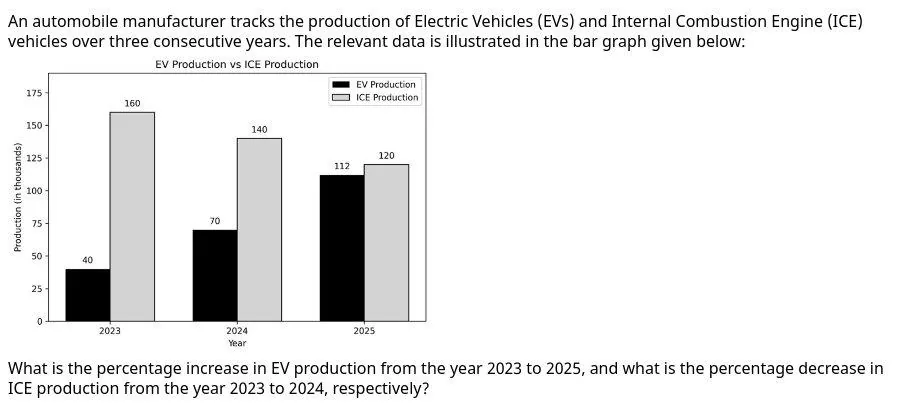
EV: 40 → 112, increase $=\frac{72}{40}\times100=180\%$. ICE: 160 → 140, decrease $=\frac{20}{160}\times100=12.5\%$. Option D.
figure
उत्तर: D
EV: 40 → 112, वृद्धि $=\frac{72}{40}\times100=180\%$। ICE: 160 → 140, कमी $=\frac{20}{160}\times100=12.5\%$। विकल्प D।
🔗 Link
Q923 Oct 2026 05:00 PM (Shift-3) · Q61Bar Graphmoderate
figure
Answer: C
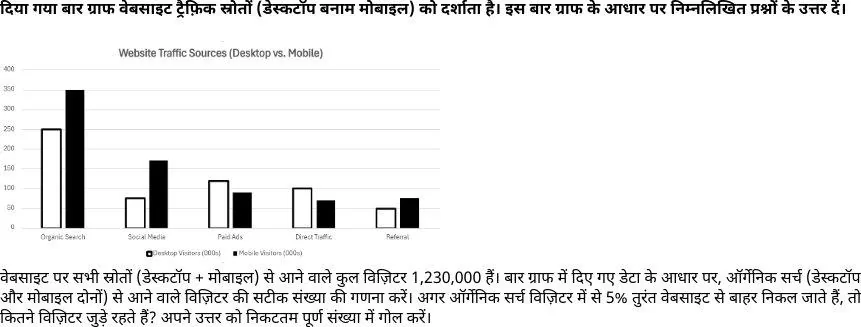
Organic Search $=250+350=600$ thousand; $95\%$ of 600000 $=570000$. Option C.
figure
उत्तर: C
ऑर्गेनिक सर्च 600000; 95% = 570000। विकल्प C।
🔗 Link
Q1027 Oct 2026 01:30 PM (Shift-2) · Q72Bar Graphmoderate
figure
Answer: D
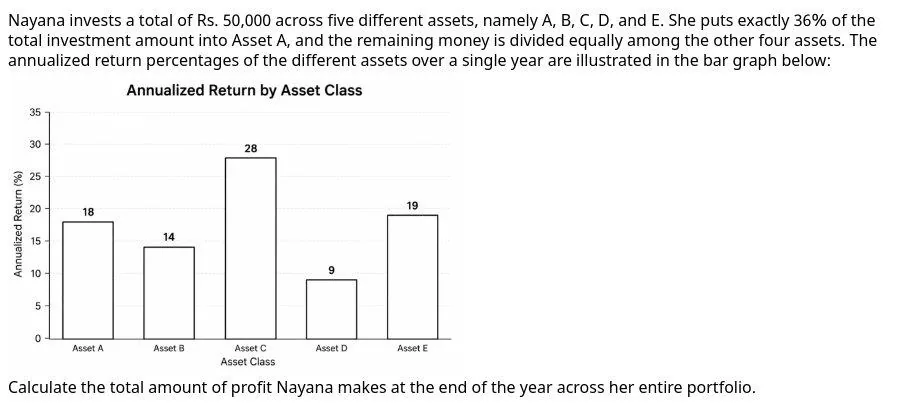
A: 18000×18% = 3240; others 8000 each: 8000×(14+28+9+19)% = 5600; total 8840. Option D.
figure
उत्तर: D
A: 3240; शेष: 5600; कुल 8840। विकल्प D।
🔗 Link
Q1127 Oct 2026 05:00 PM (Shift-3) · Q74Bar Graphmoderate
figure
Answer: B
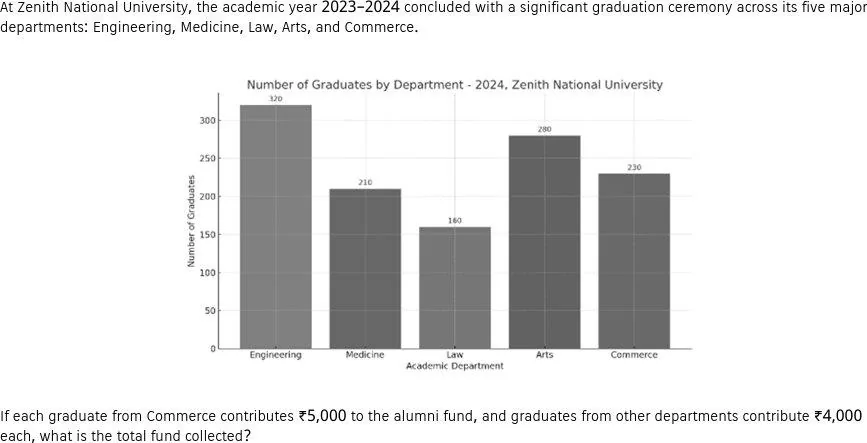
Others: $(320+210+160+280)\times4000=38,80,000$; Commerce $230\times5000=11,50,000$; total ₹50,30,000. Option B.
figure
उत्तर: B
अन्य $970\times4000=38,80,000$; वाणिज्य $11,50,000$; कुल ₹50,30,000। विकल्प B।
🔗 Link
Q1228 Oct 2026 10:00 AM (Shift-1) · Q72Bar Graphmoderate
figure
Answer: B
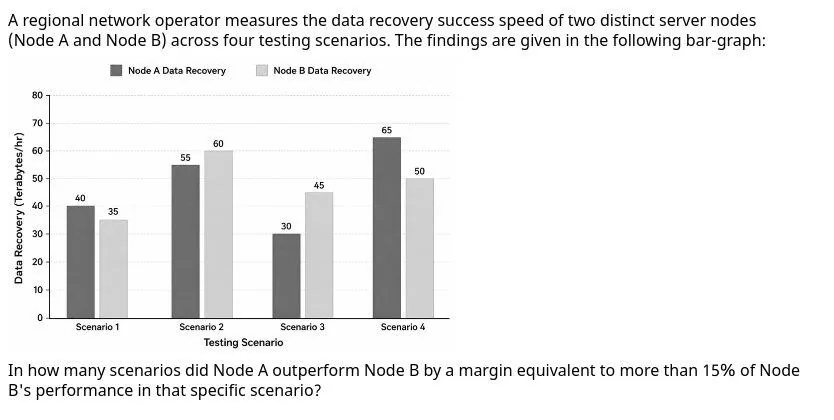
A > B only in S1 (40 vs 35: 5/35 = 14.3%, not > 15%) and S4 (65 vs 50: 30%). So 1 scenario. Option B.
figure
उत्तर: B
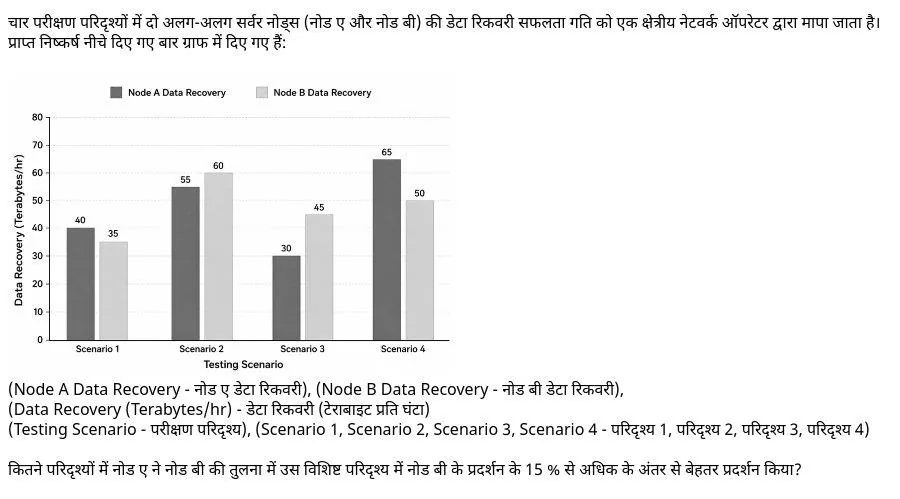
A केवल S1 (14.3%) व S4 (30%) में आगे; 15% से अधिक केवल S4। विकल्प B।
🔗 Link
Q1330 Sep 2026 05:00 PM (Shift-3) · Q75Bar Graphmoderate
figure
Answer: C
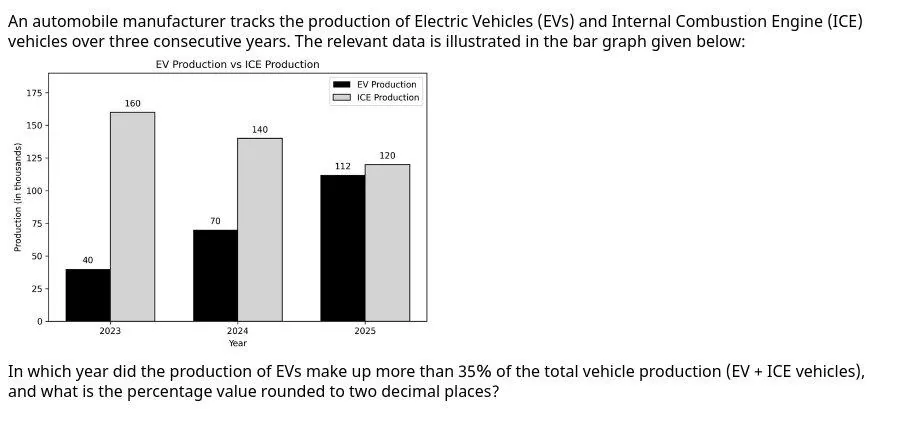
2023: 40/200 = 20%; 2024: 70/210 = 33.33%; 2025: 112/232 = 48.28%. Option C.
figure
उत्तर: C
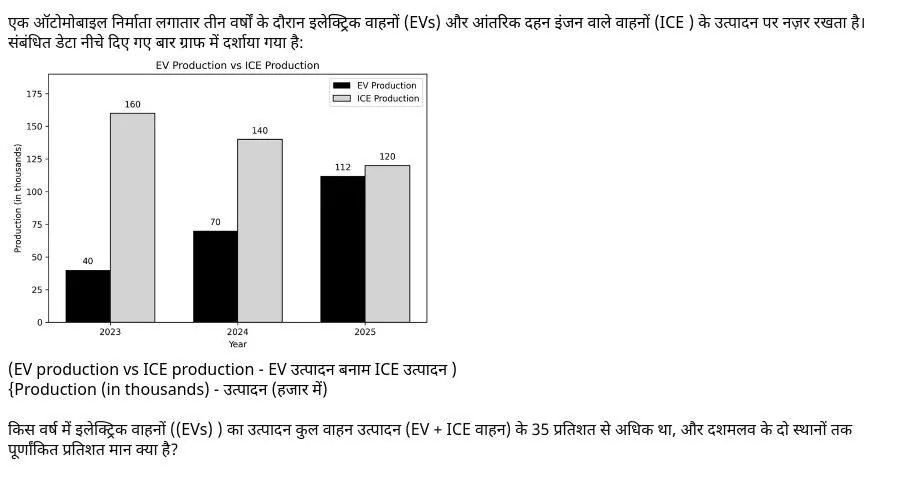
2023: 20%; 2024: 33.33%; 2025: 112/232 = 48.28%। विकल्प C।
🔗 Link
Q1428 Oct 2026 05:00 PM (Shift-3) · Q72Bar Graph – Weighted Averagemoderate
figure
Answer: D
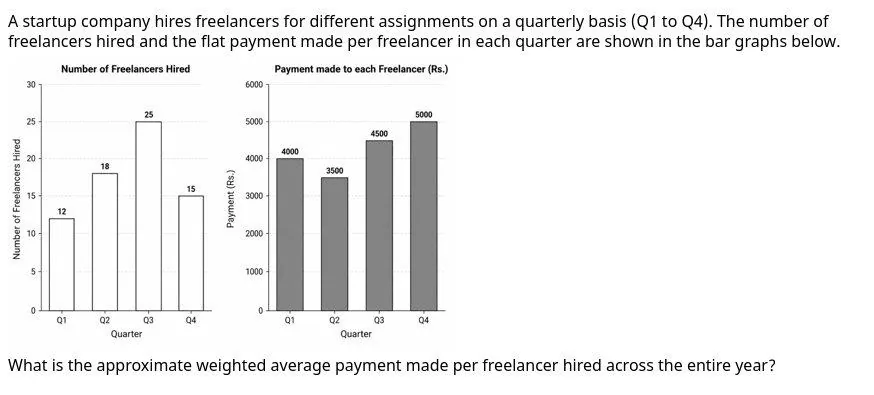
Total = 12×4000 + 18×3500 + 25×4500 + 15×5000 = 298500 over 70 freelancers = ₹4264.29. Option D.
figure
उत्तर: D
कुल = 298500, 70 फ्रीलांसर; औसत = ₹4264.29। विकल्प D।
🔗 Link
Q1514 Oct 2026 05:00 PM (Shift-3) · Q57Bar Graph (Fuel Consumption)moderate
figure
Answer: B
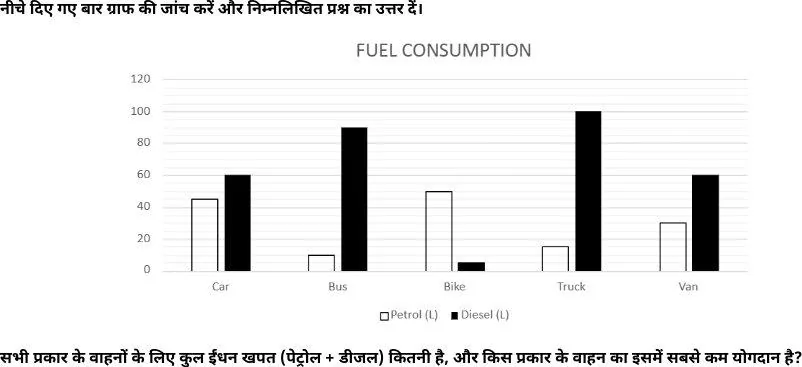
Petrol + diesel for each vehicle: Car 45 + 60 = 105; Bus 10 + 90 = 100; Bike 50 + 5 = 55; Truck 15 + 100 = 115; Van 30 + 60 = 90. Total = 465 L, and Bike contributes the least (55 L). Answer:. Option B.
figure
उत्तर: B
प्रत्येक वाहन का पेट्रोल + डीजल: कार 45 + 60 = 105; बस 10 + 90 = 100; बाइक 50 + 5 = 55; ट्रक 15 + 100 = 115; वैन 30 + 60 = 90। कुल = 465 लीटर, और बाइक का योगदान सबसे कम (55 लीटर) है। विकल्प B।
🔗 Link