CGL 2026 Tier 1EzSSC Practice
Learn › Quantitative Aptitude

Data Interpretationआँकड़ा निर्वचन

2 questions from all 53 shifts of SSC CGL Tier 1 2026 · Quant

⏱ Take a timed quiz on this topic

Tap an option to check your answer, or use “Show answer”. Switch to Hindi with the हिं button at the top.अंग्रेज़ी के लिए ऊपर EN बटन दबाएँ।
Q109 Oct 2026 05:00 PM (Shift-3) · Q58Pie Chart Percentageeasy
figure
Answer: B
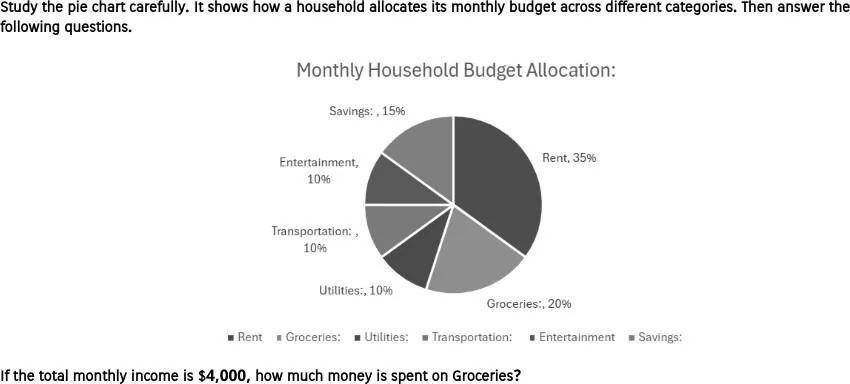
The pie chart shows Groceries at 20% of the budget. Groceries spending = 20% of \$4,000 = \$800. Option B is correct. Option B.
figure
उत्तर: B
पाई चार्ट में किराने का हिस्सा 20% है। किराने पर खर्च = \$4,000 का 20% = \$800। विकल्प B सही है। विकल्प B।
🔗 Link
Q222 Oct 2026 01:30 PM (Shift-2) · Q64Pie Chart Percentageeasy
figure
Answer: B
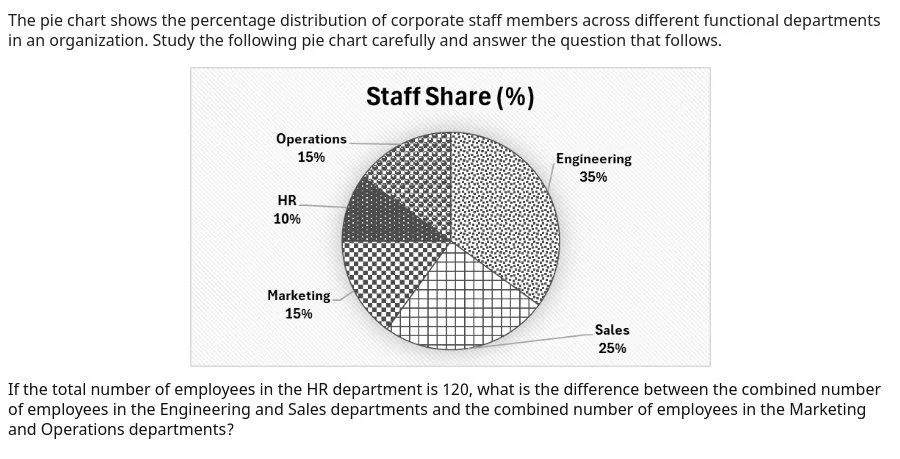
HR is 10% of the staff and has 120 employees, so the total is $120\div0.10=1200$. Engineering and Sales together are $35\%+25\%=60\%$, which is $720$. Marketing and Operations together are $15\%+15\%=30\%$, which is $360$. The difference is $720-360=360$. Option B is correct. Option B.
figure
उत्तर: B
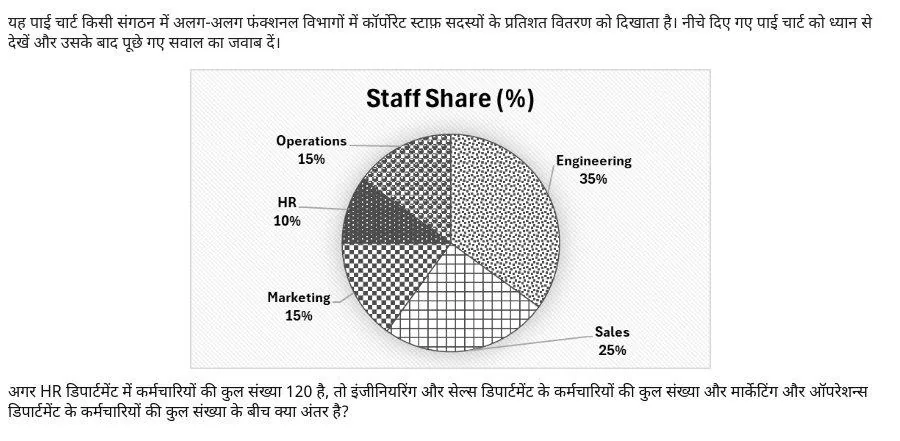
HR विभाग 10% है और उसमें 120 कर्मचारी हैं, अतः कुल कर्मचारी $120\div0.10=1200$ हैं। इंजीनियरिंग और सेल्स मिलाकर $35\%+25\%=60\%$, यानी $720$ हैं। मार्केटिंग और ऑपरेशन्स मिलाकर $15\%+15\%=30\%$, यानी $360$ हैं। अंतर $720-360=360$ है। सही उत्तर विकल्प B है। विकल्प B।
🔗 Link