CGL 2026 Tier 1EzSSC Practice
Learn › Quantitative Aptitude

Data Interpretationआँकड़ा निर्वचन

4 questions from all 53 shifts of SSC CGL Tier 1 2026 · Quant

⏱ Take a timed quiz on this topic

Tap an option to check your answer, or use “Show answer”. Switch to Hindi with the हिं button at the top.अंग्रेज़ी के लिए ऊपर EN बटन दबाएँ।
Q108 Oct 2026 05:00 PM (Shift-3) · Q56Histogram: Percentage of Frequencymoderate
figure
Answer: A
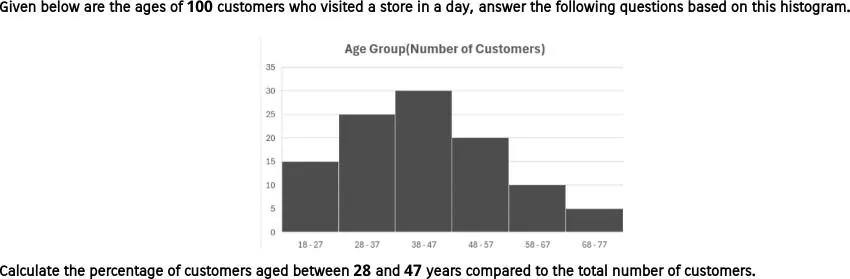
Histogram bars: 18-27 = 15, 28-37 = 25, 38-47 = 30, 48-57 = 20, 58-67 = 10, 68-77 = 5. Customers aged 28 to 47 = 25 + 30 = 55. The bars add to 105, not the stated 100, so the percentage is $\frac{55}{105} \times 100 \approx 52.4\%$, which is option A. Using 100 would give 55%, which is not offered. Option A.
figure
उत्तर: A
हिस्टोग्राम के स्तंभ: 18-27 = 15, 28-37 = 25, 38-47 = 30, 48-57 = 20, 58-67 = 10, 68-77 = 5। 28 से 47 वर्ष के ग्राहक = 25 + 30 = 55। स्तंभों का कुल योग 105 है, 100 नहीं, इसलिए प्रतिशत = $\frac{55}{105} \times 100 \approx 52.4\%$, जो विकल्प A है। विकल्प A।
🔗 Link
Q208 Oct 2026 05:00 PM (Shift-3) · Q57Histogram: Percentage of Frequencymoderate
figure
Answer: B
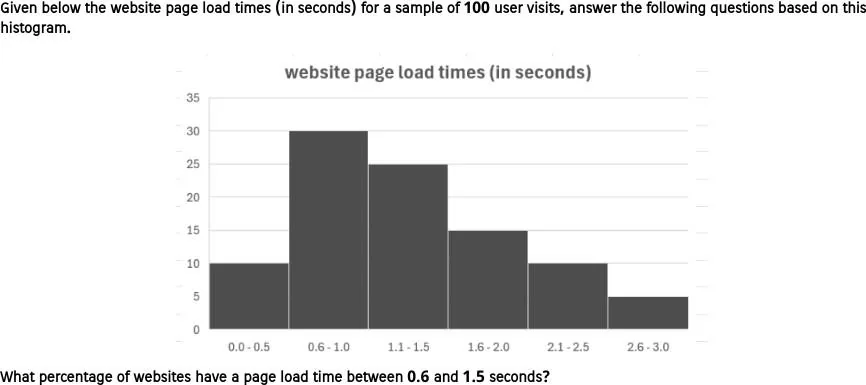
Bars for 0.6-1.0 s (30) and 1.1-1.5 s (25) cover 0.6 to 1.5 seconds, giving 55 websites. The bars add to 95 (10 + 30 + 25 + 15 + 10 + 5), so the percentage is $\frac{55}{95} \times 100 \approx 57.9\%$, about 58%, which is option B. Using the stated 100 would give 55% (option C). Option B.
figure
उत्तर: B
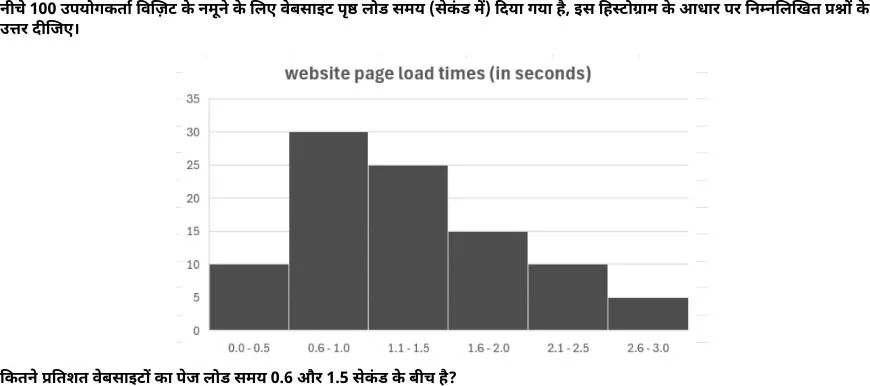
0.6-1.0 (30) और 1.1-1.5 (25) के स्तंभ 0.6 से 1.5 सेकंड के बीच हैं, कुल 55 वेबसाइटें। स्तंभों का योग 95 है (10 + 30 + 25 + 15 + 10 + 5), इसलिए प्रतिशत = $\frac{55}{95} \times 100 \approx 57.9\%$, यानी लगभग 58%, जो विकल्प B है। विकल्प B।
🔗 Link
Q313 Oct 2026 05:00 PM (Shift-3) · Q63Histogram: Percentage of Frequencymoderate
figure
Answer: B
Class frequencies: 8-9: 16, 9-13: 18, 13-18: 23, 18-24: 20, 24-31: 11, 31-40: 12, 40-50: 10. Total = 110. Employees spending more than 31 minutes are in the classes 31-40 and 40-50, so 12 + 10 = 22. Percentage = 22/110 x 100 = 20%, option B. The value 22 in option D is the count, not the percentage. Option B.
figure
उत्तर: B
वर्ग-बारंबारताएँ: 8-9: 16, 9-13: 18, 13-18: 23, 18-24: 20, 24-31: 11, 31-40: 12, 40-50: 10। कुल = 110। 31 मिनट से अधिक समय बिताने वाले कर्मचारी वर्ग 31-40 और 40-50 में हैं, अतः 12 + 10 = 22। प्रतिशत = 22/110 × 100 = 20%, जो विकल्प B है। विकल्प D का 22 कर्मचारियों की संख्या है, प्रतिशत नहीं। विकल्प B।
🔗 Link
Q414 Oct 2026 10:00 AM (Shift-1) · Q63Histogram: Percentage of Frequencyeasy
figure
Answer: D
Total cycles = 3 + 10 + 18 + 16 + 3 = 50. Cycles with battery life below 7 hours lie in the classes 5.0-5.9 and 6.0-6.9, giving 3 + 10 = 13. Percentage = 13/50 x 100 = 26%,. Option D.
figure
उत्तर: D
कुल चक्र = 3 + 10 + 18 + 16 + 3 = 50। 7 घंटे से कम वाले वर्ग 5.0–5.9 और 6.0–6.9 हैं, अतः 3 + 10 = 13। प्रतिशत = 13/50 × 100 = 26%। सही विकल्प D है। विकल्प D।
🔗 Link