CGL 2026 Tier 1EzSSC Practice
Learn › Quantitative Aptitude

Data Interpretationआँकड़ा निर्वचन

10 questions from all 53 shifts of SSC CGL Tier 1 2026 · Quant

⏱ Take a timed quiz on this topic

Tap an option to check your answer, or use “Show answer”. Switch to Hindi with the हिं button at the top.अंग्रेज़ी के लिए ऊपर EN बटन दबाएँ।
Q101 Oct 2026 05:00 PM (Shift-3) · Q57Bar Graphmoderate
figure
Answer: A
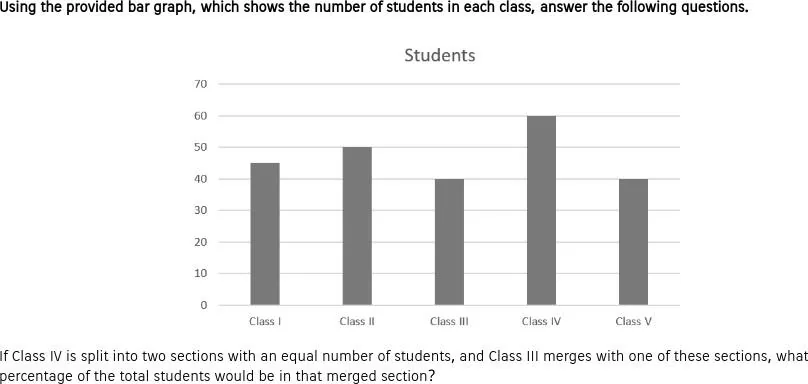
Class counts from the graph: I = 45, II = 50, III = 40, IV = 60, V = 40, total 235. Class IV splits into two sections of 30. Class III (40) merges with one section of 30, giving 70. Percentage $= \frac{70}{235} \times 100 \approx 29.8\%$, closest to 30%, option A. Option A.
figure
उत्तर: A
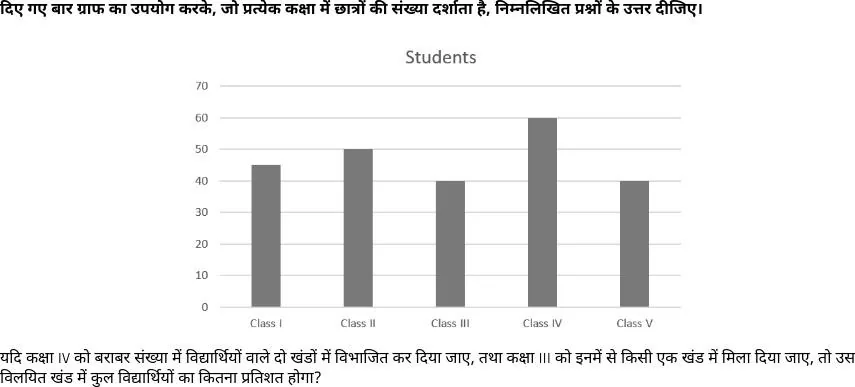
ग्राफ से कक्षाओं के छात्र: I = 45, II = 50, III = 40, IV = 60, V = 40, कुल 235। कक्षा IV के दो खंड 30-30 के हैं। कक्षा III (40) को एक खंड (30) में मिलाने पर 70 होते हैं। प्रतिशत $= \frac{70}{235} \times 100 \approx 29.8\%$ है, जो 30% के सबसे निकट है, अतः विकल्प A।
🔗 Link
Q201 Oct 2026 05:00 PM (Shift-3) · Q58Bar Graphmoderate
figure
Answer: A
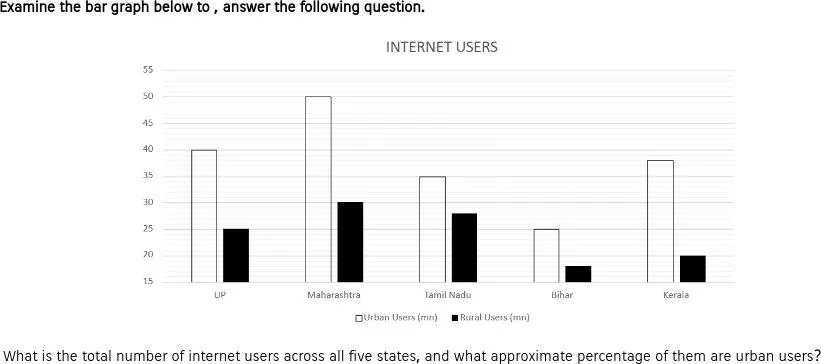
Reading the bars (urban, rural): UP 40, 25; Maharashtra 50, 30; Tamil Nadu 35, 28; Bihar 25, 18; Kerala 38, 20. State totals are 65, 80, 63, 43, 58, so the grand total is 309 million. Urban total is 40+50+35+25+38 = 188, and $188/309 \approx 60.8\%$, about 61%, option A. The axis starts at 15, not 0, so the bar tops must be read against the labelled scale. Option A.
figure
उत्तर: A
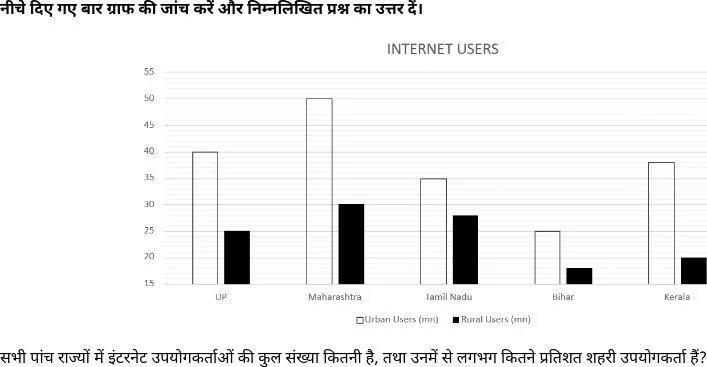
बार से पढ़े गए मान (शहरी, ग्रामीण): UP 40, 25; महाराष्ट्र 50, 30; तमिलनाडु 35, 28; बिहार 25, 18; केरल 38, 20 हैं। राज्यवार कुल 65, 80, 63, 43, 58 हैं, अतः कुल 309 मिलियन हैं। शहरी उपयोगकर्ता 188 हैं और $188/309 \approx 60.8\%$ है, यानी लगभग 61%, जो विकल्प A है। ग्राफ का अक्ष 0 से नहीं, 15 से शुरू होता है। विकल्प A।
🔗 Link
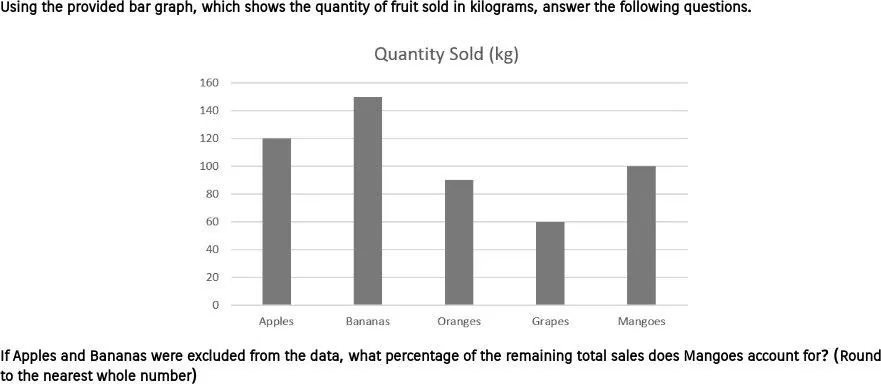
Q307 Oct 2026 05:00 PM (Shift-3) · Q56Bar Grapheasy
figure
Answer: C
Bar values in kg: Apples 120, Bananas 150, Oranges 90, Grapes 60, Mangoes 100. Excluding Apples and Bananas leaves 90 + 60 + 100 = 250 kg. Mangoes share = $\frac{100}{250} \times 100 = 40\%$, which is option C. Option C.
figure
उत्तर: C
बार ग्राफ से मान (किलोग्राम में): सेब 120, केले 150, संतरे 90, अंगूर 60, आम 100। सेब और केले हटाने पर शेष 90 + 60 + 100 = 250 किलोग्राम है। आमों का हिस्सा $\frac{100}{250} \times 100 = 40\%$ है, जो विकल्प C है। विकल्प C।
🔗 Link
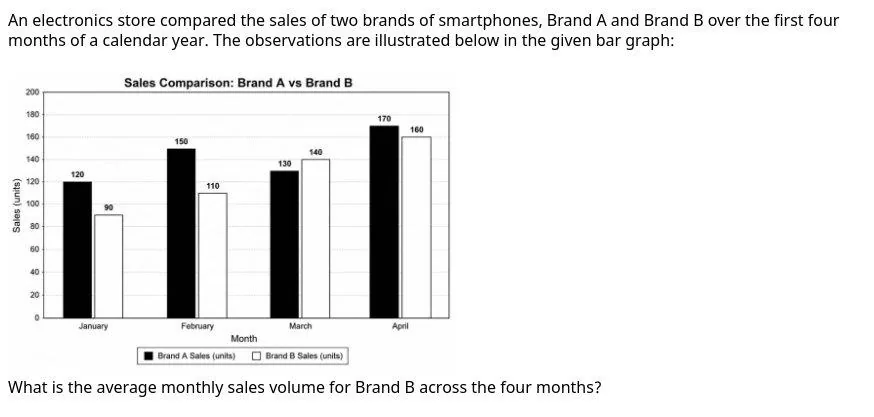
Q410 Oct 2026 01:30 PM (Shift-2) · Q74Bar Grapheasy
figure
Answer: B
Brand B sales: January 90, February 110, March 140, April 160. Total = 500 units. Average = 500 / 4 = 125 units. Answer: B. Option B.
figure
उत्तर: B
ब्रांड B की बिक्री: जनवरी 90, फरवरी 110, मार्च 140, अप्रैल 160 इकाई। कुल = 500 इकाई। औसत = 500 / 4 = 125 इकाई। उत्तर: B। विकल्प B।
🔗 Link
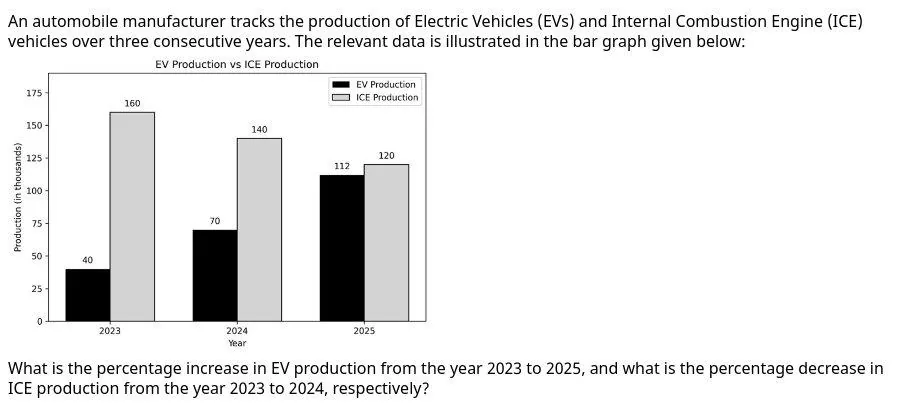
Q523 Oct 2026 10:00 AM (Shift-1) · Q73Bar Grapheasy
figure
Answer: D
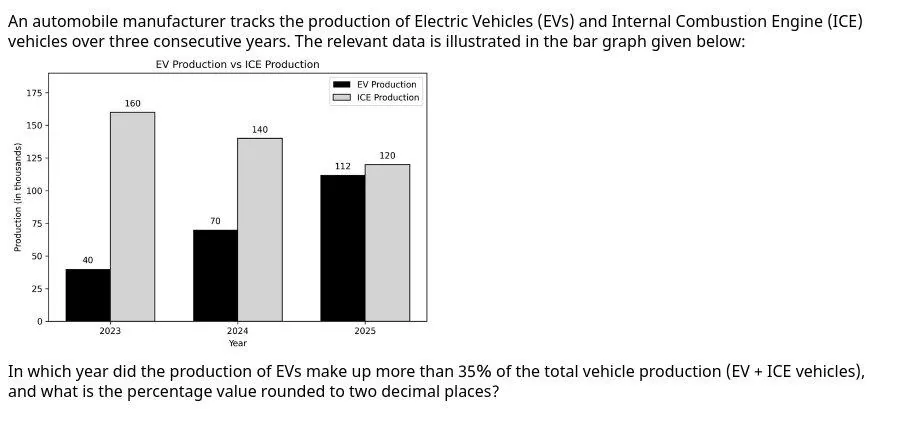
EV: 40 → 112, increase $=\frac{72}{40}\times100=180\%$. ICE: 160 → 140, decrease $=\frac{20}{160}\times100=12.5\%$. Option D.
figure
उत्तर: D
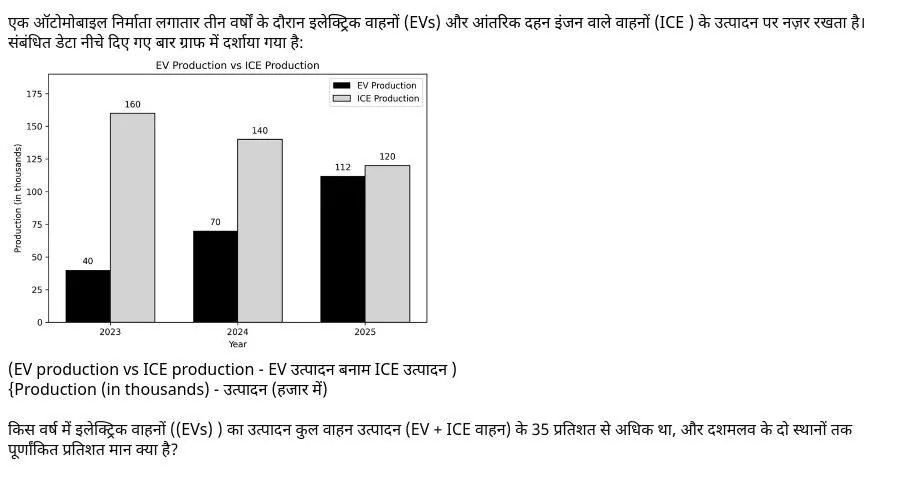
EV: 40 → 112, वृद्धि $=\frac{72}{40}\times100=180\%$। ICE: 160 → 140, कमी $=\frac{20}{160}\times100=12.5\%$। विकल्प D।
🔗 Link
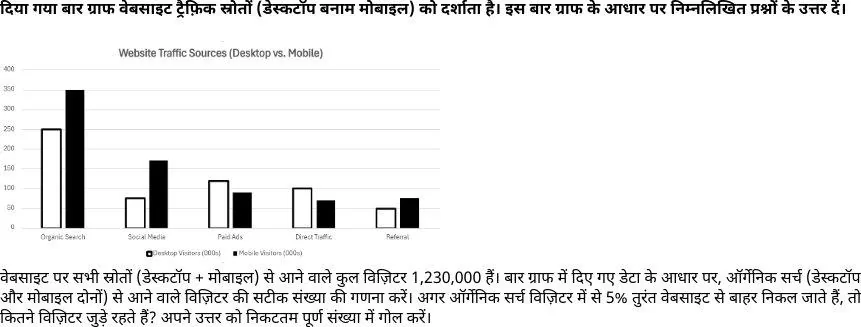
Q623 Oct 2026 05:00 PM (Shift-3) · Q61Bar Graphmoderate
figure
Answer: C
Organic Search $=250+350=600$ thousand; $95\%$ of 600000 $=570000$. Option C.
figure
उत्तर: C
ऑर्गेनिक सर्च 600000; 95% = 570000। विकल्प C।
🔗 Link
Q727 Oct 2026 01:30 PM (Shift-2) · Q72Bar Graphmoderate
figure
Answer: D
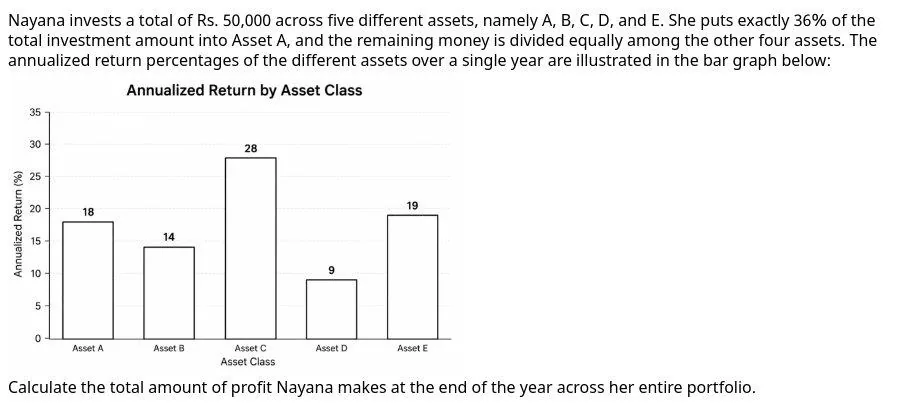
A: 18000×18% = 3240; others 8000 each: 8000×(14+28+9+19)% = 5600; total 8840. Option D.
figure
उत्तर: D
A: 3240; शेष: 5600; कुल 8840। विकल्प D।
🔗 Link
Q827 Oct 2026 05:00 PM (Shift-3) · Q74Bar Graphmoderate
figure
Answer: B
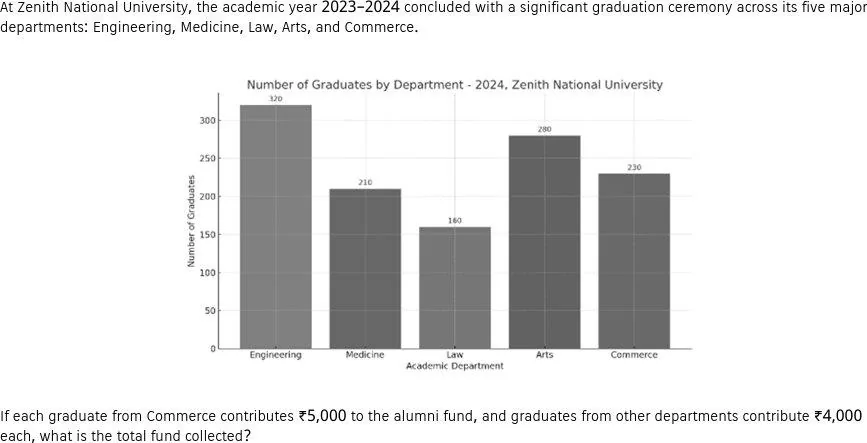
Others: $(320+210+160+280)\times4000=38,80,000$; Commerce $230\times5000=11,50,000$; total ₹50,30,000. Option B.
figure
उत्तर: B
अन्य $970\times4000=38,80,000$; वाणिज्य $11,50,000$; कुल ₹50,30,000। विकल्प B।
🔗 Link
Q928 Oct 2026 10:00 AM (Shift-1) · Q72Bar Graphmoderate
figure
Answer: B
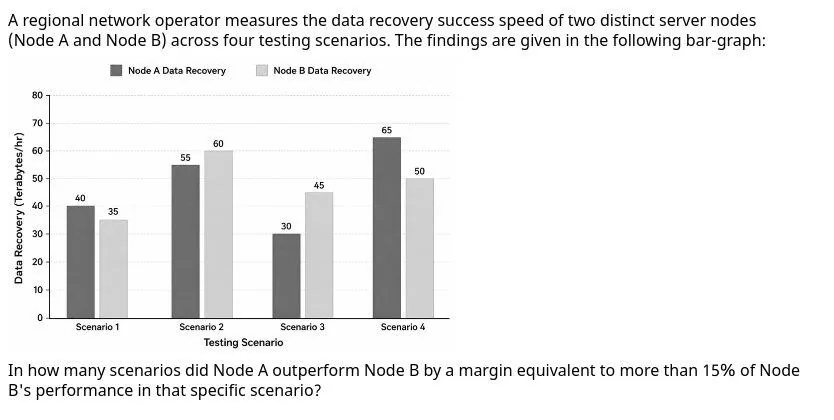
A > B only in S1 (40 vs 35: 5/35 = 14.3%, not > 15%) and S4 (65 vs 50: 30%). So 1 scenario. Option B.
figure
उत्तर: B
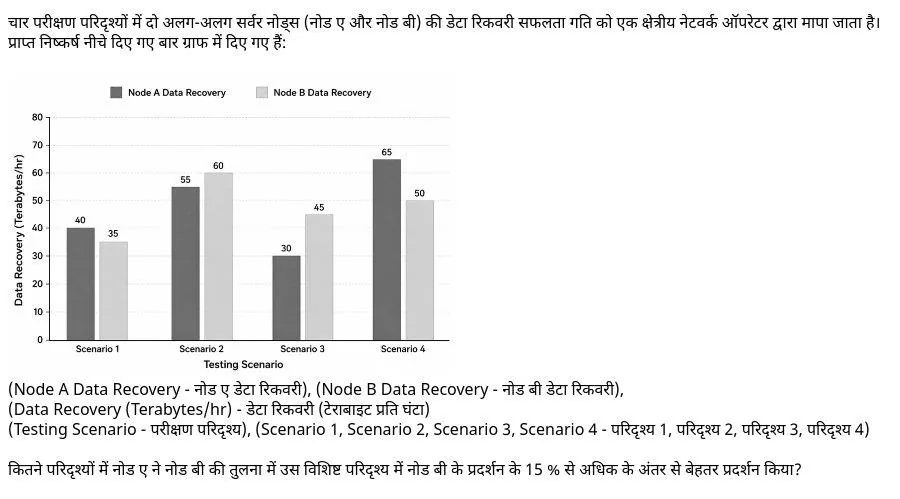
A केवल S1 (14.3%) व S4 (30%) में आगे; 15% से अधिक केवल S4। विकल्प B।
🔗 Link
Q1030 Sep 2026 05:00 PM (Shift-3) · Q75Bar Graphmoderate
figure
Answer: C
2023: 40/200 = 20%; 2024: 70/210 = 33.33%; 2025: 112/232 = 48.28%. Option C.
figure
उत्तर: C
2023: 20%; 2024: 33.33%; 2025: 112/232 = 48.28%। विकल्प C।
🔗 Link