CGL 2026 Tier 1EzSSC Practice
Learn › Quantitative Aptitude

Data Interpretationआँकड़ा निर्वचन

95 questions from all 53 shifts of SSC CGL Tier 1 2026 · Quant

⏱ Take a timed quiz on this topic

Tap an option to check your answer, or use “Show answer”. Switch to Hindi with the हिं button at the top.अंग्रेज़ी के लिए ऊपर EN बटन दबाएँ।
Q6108 Oct 2026 05:00 PM (Shift-3) · Q57Histogram: Percentage of Frequencymoderate
figure
Answer: B
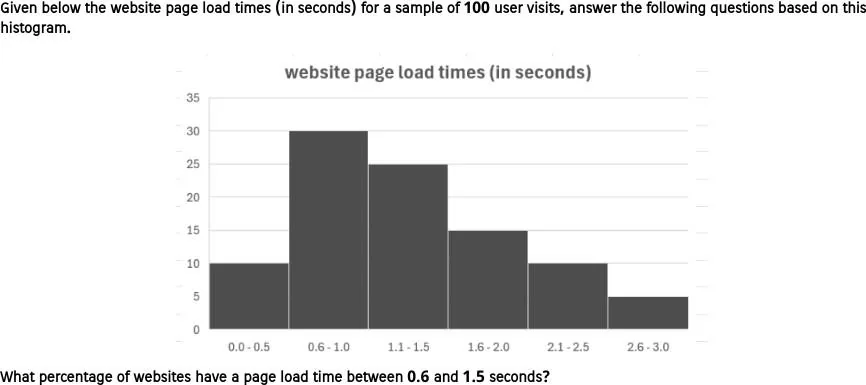
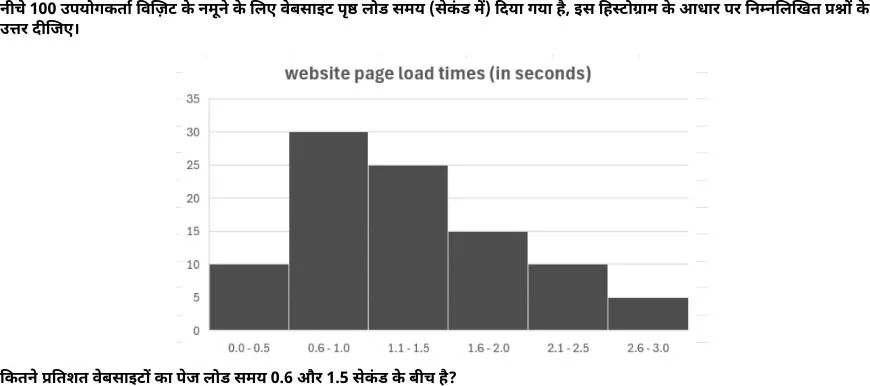
Bars for 0.6-1.0 s (30) and 1.1-1.5 s (25) cover 0.6 to 1.5 seconds, giving 55 websites. The bars add to 95 (10 + 30 + 25 + 15 + 10 + 5), so the percentage is $\frac{55}{95} \times 100 \approx 57.9\%$, about 58%, which is option B. Using the stated 100 would give 55% (option C). Option B.
figure
उत्तर: B
0.6-1.0 (30) और 1.1-1.5 (25) के स्तंभ 0.6 से 1.5 सेकंड के बीच हैं, कुल 55 वेबसाइटें। स्तंभों का योग 95 है (10 + 30 + 25 + 15 + 10 + 5), इसलिए प्रतिशत = $\frac{55}{95} \times 100 \approx 57.9\%$, यानी लगभग 58%, जो विकल्प B है। विकल्प B।
🔗 Link
Q6213 Oct 2026 05:00 PM (Shift-3) · Q63Histogram: Percentage of Frequencymoderate
figure
Answer: B
Class frequencies: 8-9: 16, 9-13: 18, 13-18: 23, 18-24: 20, 24-31: 11, 31-40: 12, 40-50: 10. Total = 110. Employees spending more than 31 minutes are in the classes 31-40 and 40-50, so 12 + 10 = 22. Percentage = 22/110 x 100 = 20%, option B. The value 22 in option D is the count, not the percentage. Option B.
figure
उत्तर: B
वर्ग-बारंबारताएँ: 8-9: 16, 9-13: 18, 13-18: 23, 18-24: 20, 24-31: 11, 31-40: 12, 40-50: 10। कुल = 110। 31 मिनट से अधिक समय बिताने वाले कर्मचारी वर्ग 31-40 और 40-50 में हैं, अतः 12 + 10 = 22। प्रतिशत = 22/110 × 100 = 20%, जो विकल्प B है। विकल्प D का 22 कर्मचारियों की संख्या है, प्रतिशत नहीं। विकल्प B।
🔗 Link
Q6314 Oct 2026 10:00 AM (Shift-1) · Q63Histogram: Percentage of Frequencyeasy
figure
Answer: D
Total cycles = 3 + 10 + 18 + 16 + 3 = 50. Cycles with battery life below 7 hours lie in the classes 5.0-5.9 and 6.0-6.9, giving 3 + 10 = 13. Percentage = 13/50 x 100 = 26%,. Option D.
figure
उत्तर: D
कुल चक्र = 3 + 10 + 18 + 16 + 3 = 50। 7 घंटे से कम वाले वर्ग 5.0–5.9 और 6.0–6.9 हैं, अतः 3 + 10 = 13। प्रतिशत = 13/50 × 100 = 26%। सही विकल्प D है। विकल्प D।
🔗 Link
Q6412 Oct 2026 05:00 PM (Shift-3) · Q72Histogram: Share of Totaleasy
figure
Answer: D
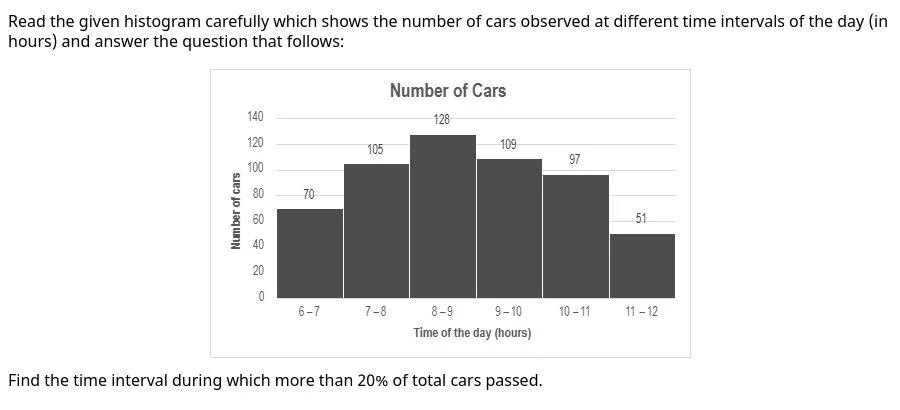
Bar values: 6-7 = 70, 7-8 = 105, 8-9 = 128, 9-10 = 109, 10-11 = 97, 11-12 = 51. Total = 560, so 20% of the total = 112. Only the 8-9 interval (128) exceeds 112; 9-10 (109) and 7-8 (105) do not. Answer: D. Option D.
figure
उत्तर: D
बार मान: 6-7 = 70, 7-8 = 105, 8-9 = 128, 9-10 = 109, 10-11 = 97, 11-12 = 51। कुल = 560, अतः कुल का 20% = 112। केवल 8-9 अंतराल (128) 112 से अधिक है; 9-10 (109) और 7-8 (105) नहीं। उत्तर: D। विकल्प D।
🔗 Link
Q6512 Oct 2026 05:00 PM (Shift-3) · Q54Mean from Frequency Polygonmoderate
figure
Answer: A
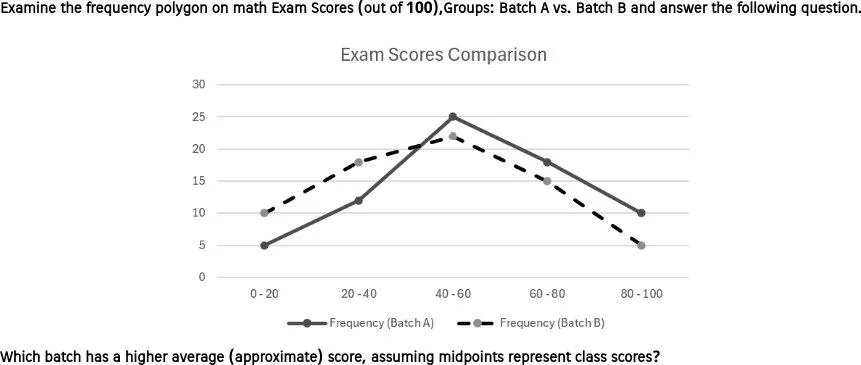
Midpoints are 10, 30, 50, 70, 90. Batch A frequencies 5, 12, 25, 18, 10 (total 70) give $\sum fx=3820$, mean $=54.6$. Batch B frequencies 10, 18, 22, 15, 5 (total 70) give $\sum fx=3240$, mean $=46.3$. Batch A has the higher average. Answer: A. Option A.
figure
उत्तर: A
मध्यबिंदु 10, 30, 50, 70, 90 हैं। बैच ए की आवृत्तियाँ 5, 12, 25, 18, 10 (कुल 70) हैं, $\sum fx=3820$, माध्य $=54.6$। बैच बी की आवृत्तियाँ 10, 18, 22, 15, 5 (कुल 70) हैं, $\sum fx=3240$, माध्य $=46.3$। बैच ए का औसत अधिक है। उत्तर: A। विकल्प A।
🔗 Link
Q6601 Oct 2026 05:00 PM (Shift-3) · Q59Pie Charteasy
figure
Answer: C
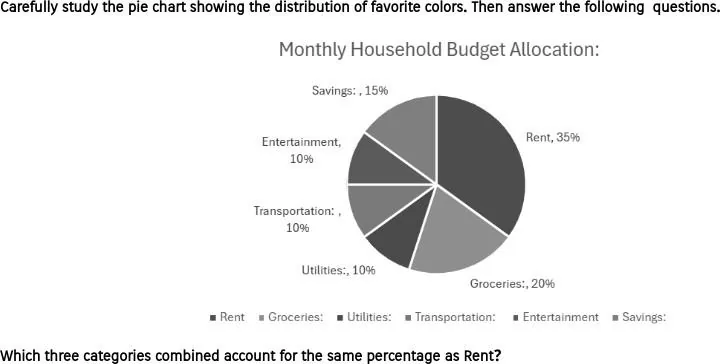
Rent is 35% of the budget. Chart values: Groceries 20%, Utilities 10%, Transportation 10%, Entertainment 10%, Savings 15%. Utilities + Transportation + Entertainment = 30%. Groceries + Entertainment + Savings = 45%. Transportation + Entertainment + Savings = 10 + 10 + 15 = 35%. Option C. The fourth option includes Rent itself, so it cannot be the answer. Option C.
figure
उत्तर: C
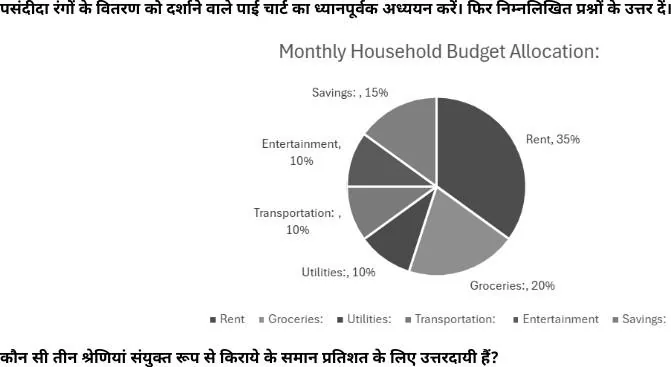
किराया बजट का 35% है। चार्ट के मान: किराने का सामान 20%, उपयोगिताएँ 10%, परिवहन 10%, मनोरंजन 10%, बचत 15%। उपयोगिताएँ + परिवहन + मनोरंजन = 30%, किराने का सामान + मनोरंजन + बचत = 45%, और परिवहन + मनोरंजन + बचत = 10 + 10 + 15 = 35% है। अतः उत्तर विकल्प C है। विकल्प C।
🔗 Link
Q6701 Oct 2026 05:00 PM (Shift-3) · Q74Pie Chartmoderate
figure
Answer: C
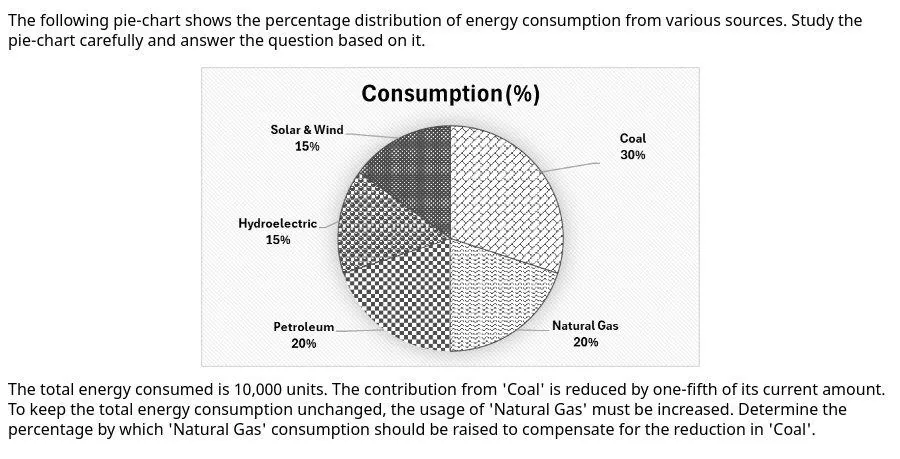
Coal is 30% of 10,000 = 3,000. One-fifth of it is 600, so coal falls to 2,400. Natural Gas is 20% of 10,000 = 2,000 and must rise by 600. Percentage increase $= \frac{600}{2000} \times 100 = 30\%$, option C. Option C.
figure
उत्तर: C
कोयला: 10,000 का 30% = 3,000। इसका एक-पाँचवाँ भाग 600 है, अतः कोयला 2,400 हो जाता है। प्राकृतिक गैस 20% = 2,000 है और उसे 600 बढ़ाना है। वृद्धि प्रतिशत $\frac{600}{2000} \times 100 = 30\%$ है, जो विकल्प C है। विकल्प C।
🔗 Link
Q6806 Oct 2026 05:00 PM (Shift-3) · Q72Pie Chartmoderate
figure
Answer: C
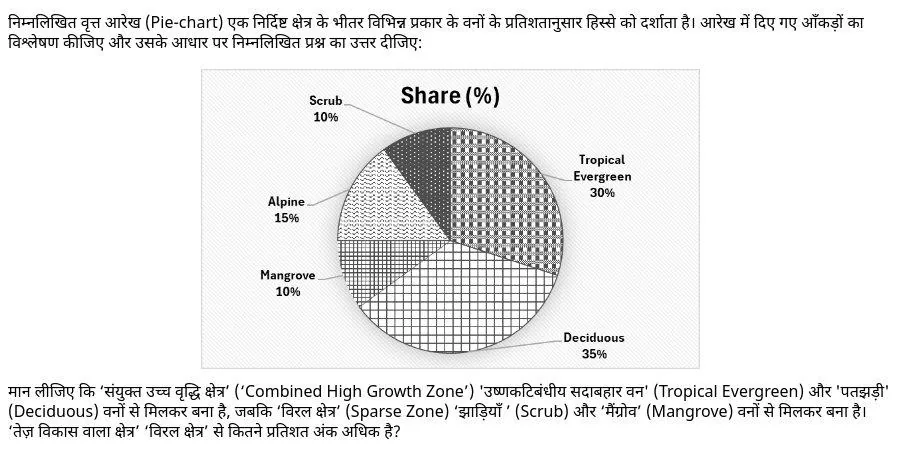
High Growth Zone = Tropical Evergreen 30% + Deciduous 35% = 65%. Sparse Zone = Scrub 10% + Mangrove 10% = 20%. Difference = 65 - 20 = 45 percentage points. Answer: C. Option C.
figure
उत्तर: C
उच्च वृद्धि क्षेत्र = उष्णकटिबंधीय सदाबहार 30% + पतझड़ी 35% = 65%। विरल क्षेत्र = झाड़ियाँ 10% + मैंग्रोव 10% = 20%। अंतर = 65 - 20 = 45 प्रतिशत अंक। उत्तर: C। विकल्प C।
🔗 Link
Q6907 Oct 2026 05:00 PM (Shift-3) · Q59Pie Charteasy
figure
Answer: A
Blue is 35%. Green (15%) + Red (20%) = 35%, equal to Blue. The other pairs give Purple + Yellow = 20%, Green + Orange = 25% and Red + Orange = 30%. Option A is correct. Option A.
figure
उत्तर: A
नीला रंग 35% है। हरा (15%) और लाल (20%) का योग 35% है, जो नीले के बराबर है। बैंगनी और पीला 20%, हरा और नारंगी 25%, और लाल और नारंगी 30% हैं। अतः विकल्प A सही है। विकल्प A।
🔗 Link
Q7009 Oct 2026 10:00 AM (Shift-1) · Q69Pie Charteasy
figure
Answer: A
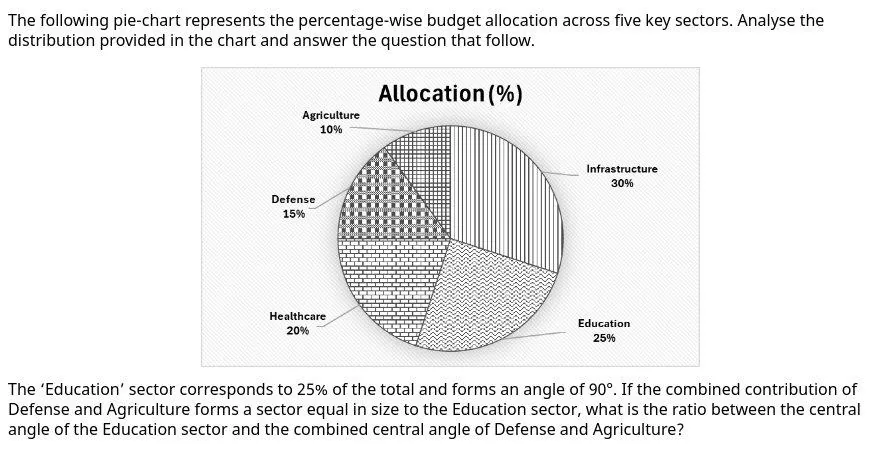
Education is 25% of the total and has a central angle of 90°. Defense (15%) plus Agriculture (10%) is also 25%, so its combined central angle is also 90°. The ratio of Education's angle to the combined Defense and Agriculture angle is 90:90 = 1:1. Answer: option A. Option A.
figure
उत्तर: A
शिक्षा कुल का 25% है और उसका केंद्रीय कोण 90° है। रक्षा (15%) और कृषि (10%) मिलकर भी 25% हैं, अतः उनका संयुक्त केंद्रीय कोण भी 90° है। शिक्षा के कोण और रक्षा तथा कृषि के संयुक्त कोण का अनुपात 90:90 = 1:1 है। उत्तर: विकल्प A।
🔗 Link
Q7110 Oct 2026 01:30 PM (Shift-2) · Q67Pie Charteasy
figure
Answer: B
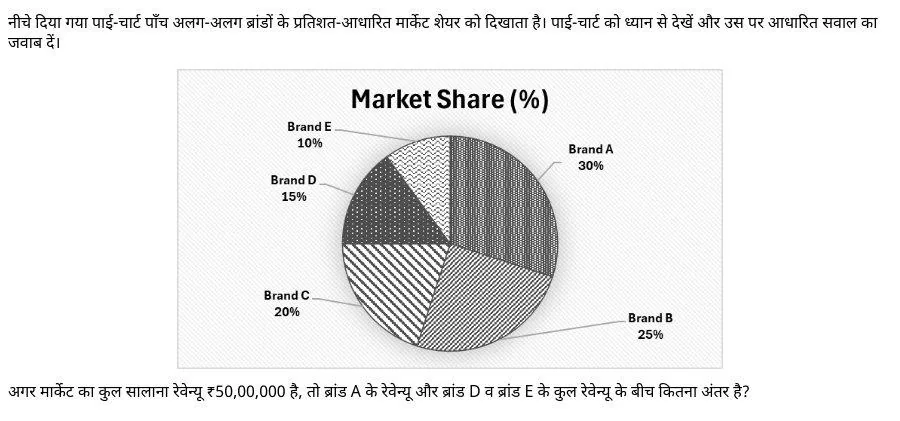
Brand A = 30% of ₹50,00,000 = ₹15,00,000. Brand D + Brand E = 15% + 10% = 25% = ₹12,50,000. Difference = 15,00,000 - 12,50,000 = ₹2,50,000. Answer: B. Option B.
figure
उत्तर: B
ब्रांड A = 30% of ₹50,00,000 = ₹15,00,000। ब्रांड D + ब्रांड E = 15% + 10% = 25% = ₹12,50,000। अंतर = 15,00,000 - 12,50,000 = ₹2,50,000। उत्तर: B। विकल्प B।
🔗 Link
Q7210 Oct 2026 05:00 PM (Shift-3) · Q71Pie Charteasy
figure
Answer: C
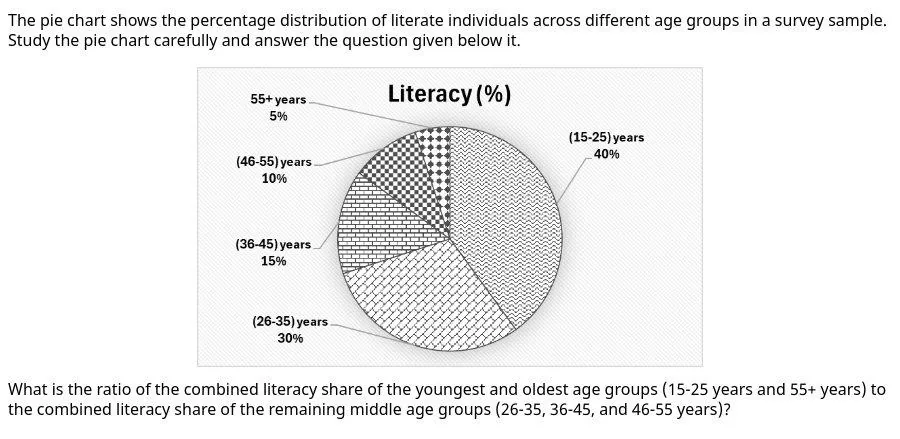
The youngest group (15-25) has 40% and the oldest (55+) has 5%, so together they have 45%. The middle groups 26-35 (30%), 36-45 (15%) and 46-55 (10%) together have 55%. The ratio is $45:55=9:11$, which is. Option C.
figure
उत्तर: C
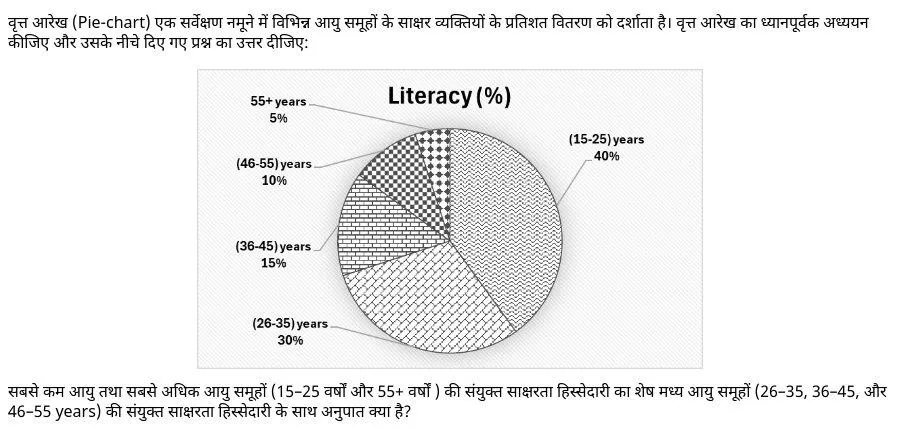
सबसे कम आयु समूह (15-25) का हिस्सा 40% और सबसे अधिक आयु समूह (55+) का 5% है, अतः दोनों का योग 45% है। मध्य समूहों 26-35 (30%), 36-45 (15%) और 46-55 (10%) का योग 55% है। अनुपात $45:55=9:11$ है, जो विकल्प C है। विकल्प C।
🔗 Link
Q7315 Oct 2026 01:30 PM (Shift-2) · Q65Pie Chartmoderate
figure
Answer: B
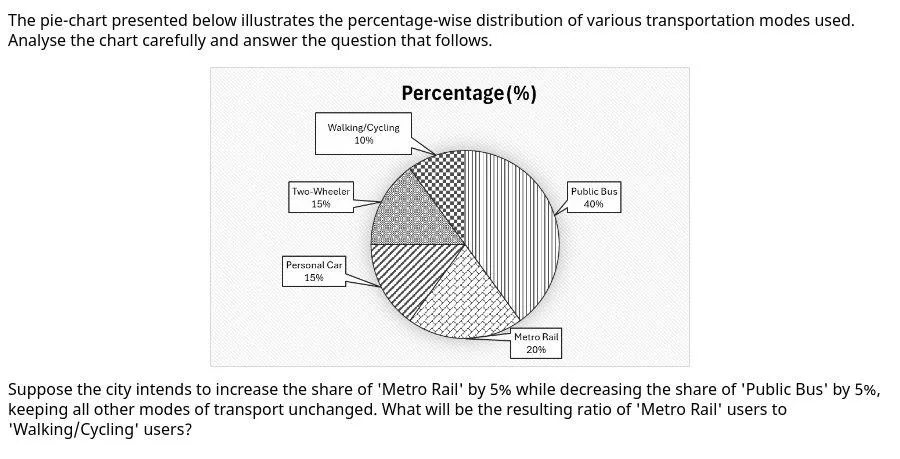
From the pie chart: Public Bus 40%, Metro Rail 20%, Personal Car 15%, Two-Wheeler 15%, Walking/Cycling 10%. After the change Metro Rail = 25% and Public Bus = 35%, while Walking/Cycling stays 10%. The ratio Metro Rail : Walking/Cycling = 25 : 10 = 5 : 2. The Public Bus change does not affect this ratio. Answer: B. Option B.
figure
उत्तर: B
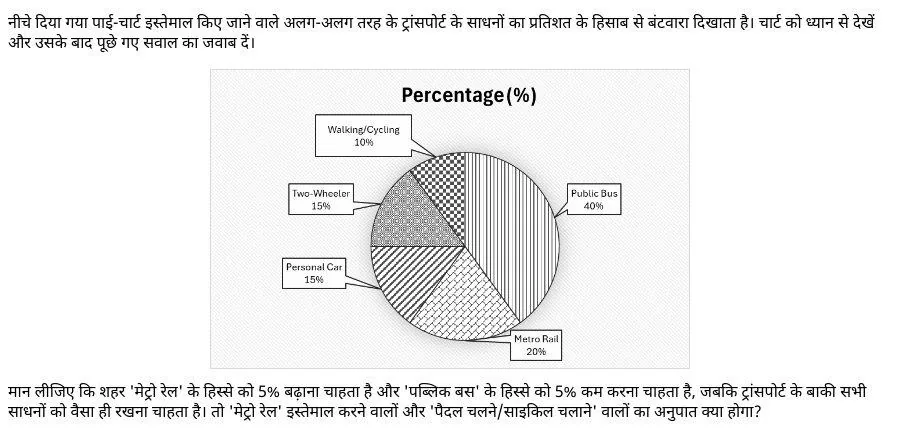
पाई चार्ट से: पब्लिक बस 40%, मेट्रो रेल 20%, पर्सनल कार 15%, टू-व्हीलर 15%, पैदल/साइकिल 10%। बदलाव के बाद मेट्रो रेल = 25% और पब्लिक बस = 35%, जबकि पैदल/साइकिल 10% ही रहता है। मेट्रो रेल : पैदल/साइकिल = 25 : 10 = 5 : 2। पब्लिक बस में बदलाव इस अनुपात को प्रभावित नहीं करता। उत्तर: B. विकल्प B।
🔗 Link
Q7423 Oct 2026 10:00 AM (Shift-1) · Q65Pie Charteasy
figure
Answer: D
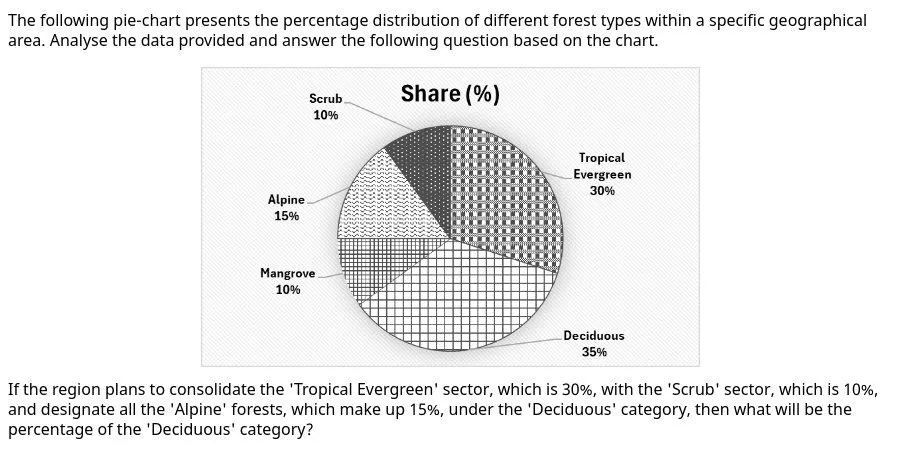
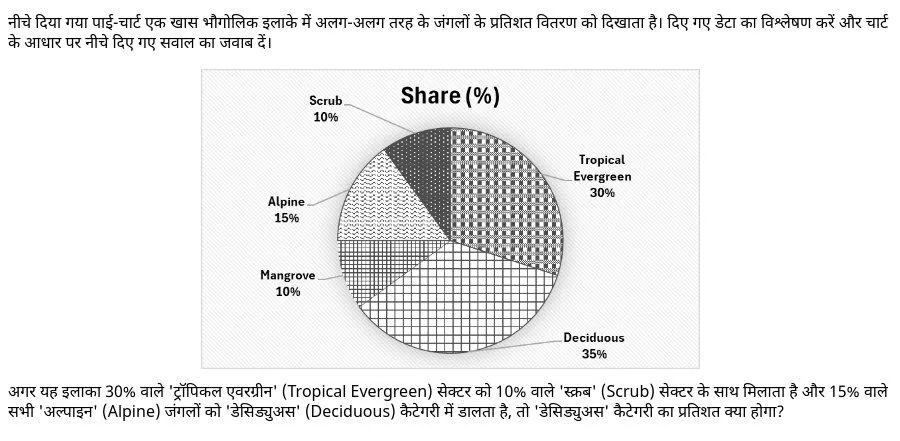
Deciduous is 35%. Adding Alpine (15%) gives $35+15=50\%$. The Tropical Evergreen–Scrub merger does not affect Deciduous. Option D.
figure
उत्तर: D
डेसिड्युअस 35% है। अल्पाइन (15%) जोड़ने पर $35+15=50\%$। ट्रॉपिकल एवरग्रीन–स्क्रब विलय से डेसिड्युअस पर असर नहीं पड़ता। विकल्प D।
🔗 Link
Q7523 Oct 2026 05:00 PM (Shift-3) · Q53Pie Charteasy
figure
Answer: B
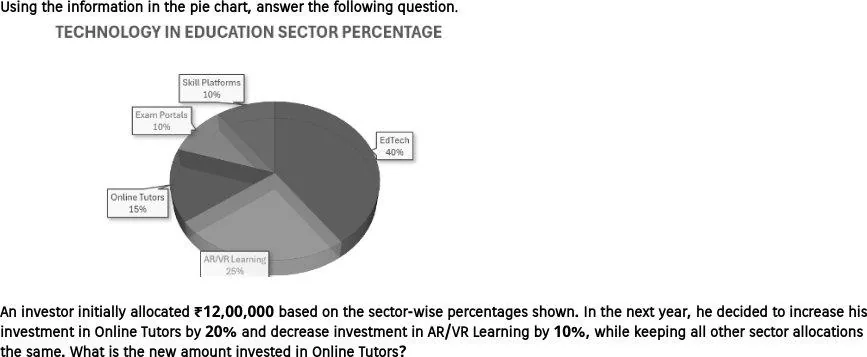
Online Tutors $=15\%\times1200000=180000$; $\times1.2=216000$. Option B.
figure
उत्तर: B
ऑनलाइन ट्यूटर्स $=180000$; 20% वृद्धि से 216000। विकल्प B।
🔗 Link