CGL 2026 Tier 1EzSSC Practice
Learn › Quantitative Aptitude

Data Interpretationआँकड़ा निर्वचन

95 questions from all 53 shifts of SSC CGL Tier 1 2026 · Quant

⏱ Take a timed quiz on this topic

Tap an option to check your answer, or use “Show answer”. Switch to Hindi with the हिं button at the top.अंग्रेज़ी के लिए ऊपर EN बटन दबाएँ।
Q1615 Oct 2026 01:30 PM (Shift-2) · Q74Bar Graph and Net Deficitmoderate
figure
Answer: B
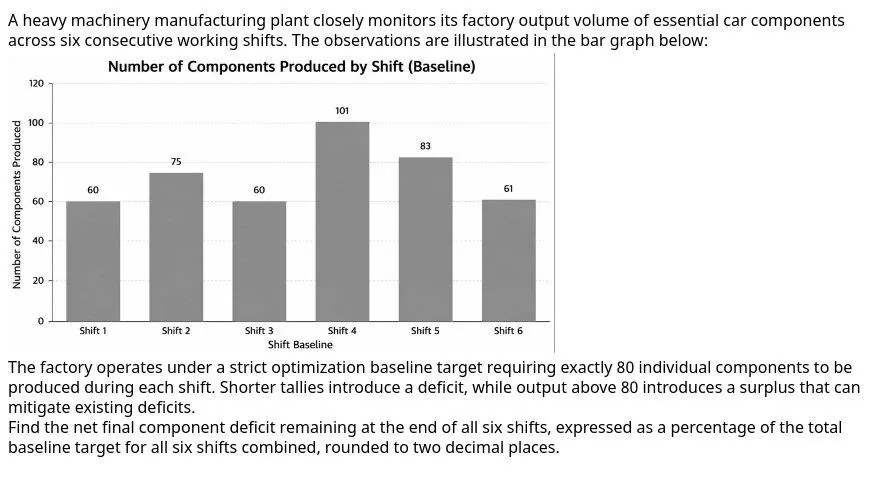
Components produced: 60 + 75 + 60 + 101 + 83 + 61 = 440. Baseline target = 6 x 80 = 480. Net deficit = 480 - 440 = 40 (the surplus of shift 4 and shift 5 offsets part of the shortfalls, and the net is what remains). Percentage = 40/480 x 100 = 8.33%. Answer: B. Option B.
figure
उत्तर: B
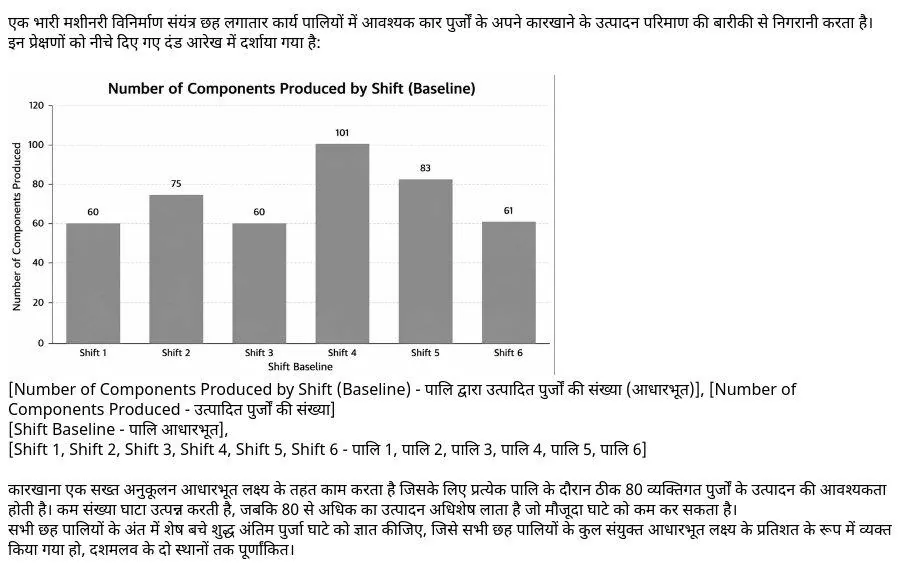
उत्पादित पुर्जे: 60 + 75 + 60 + 101 + 83 + 61 = 440। आधारभूत लक्ष्य = 6 × 80 = 480। शुद्ध घाटा = 480 − 440 = 40 (पालि 4 और 5 का अधिशेष कुछ कमी की भरपाई करता है, और शेष शुद्ध घाटा यही है)। प्रतिशत = 40/480 × 100 = 8.33%। उत्तर: B. विकल्प B।
🔗 Link
Q1709 Oct 2026 05:00 PM (Shift-3) · Q56Bar Graph and Percentage Changemoderate
figure
Answer: A
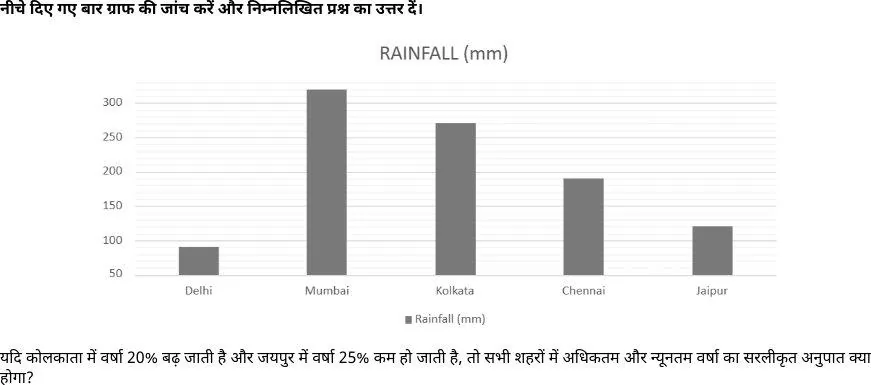
From the graph, Kolkata is about 270 mm and rises 20% to about 324 mm, the highest value. Jaipur is about 120 mm and falls 25% to about 90 mm, which is also the lowest (Delhi is about 90 mm). The ratio 324 : 90 = 18 : 5, so option A is correct. Option A.
figure
उत्तर: A
ग्राफ के अनुसार कोलकाता लगभग 270 मिमी है, जो 20% बढ़कर लगभग 324 मिमी (सबसे अधिक) हो जाता है। जयपुर लगभग 120 मिमी है, जो 25% घटकर लगभग 90 मिमी (सबसे कम) हो जाता है। दिल्ली भी लगभग 90 मिमी है। अनुपात 324 : 90 = 18 : 5 है, इसलिए विकल्प A सही है। विकल्प A।
🔗 Link
Q1816 Oct 2026 10:00 AM (Shift-1) · Q53Bar Graph Averagemoderate
figure
Answer: A
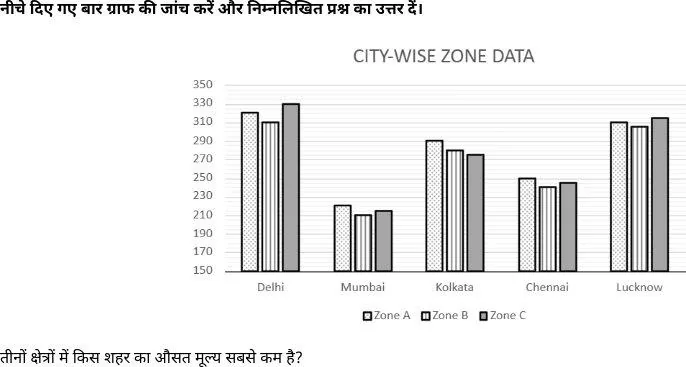
Reading the bars for Zone A, Zone B and Zone C: Mumbai is about 222, 212 and 216, average about 217. Chennai is about 250, 240 and 245, average about 245. Kolkata averages about 282, Lucknow about 311 and Delhi about 320. The lowest average is Mumbai,. Option A.
figure
उत्तर: A
ज़ोन A, ज़ोन B और ज़ोन C के बार पढ़ने पर: मुंबई के लगभग 222, 212 और 216 हैं, औसत लगभग 217। चेन्नई के लगभग 250, 240 और 245 हैं, औसत लगभग 245। कोलकाता का औसत लगभग 282, लखनऊ का लगभग 311 और दिल्ली का लगभग 320 है। सबसे कम औसत मुंबई का है, अतः सही उत्तर विकल्प A है। विकल्प A।
🔗 Link
Q1909 Oct 2026 10:00 AM (Shift-1) · Q74Bar Graph Percentageeasy
figure
Answer: A
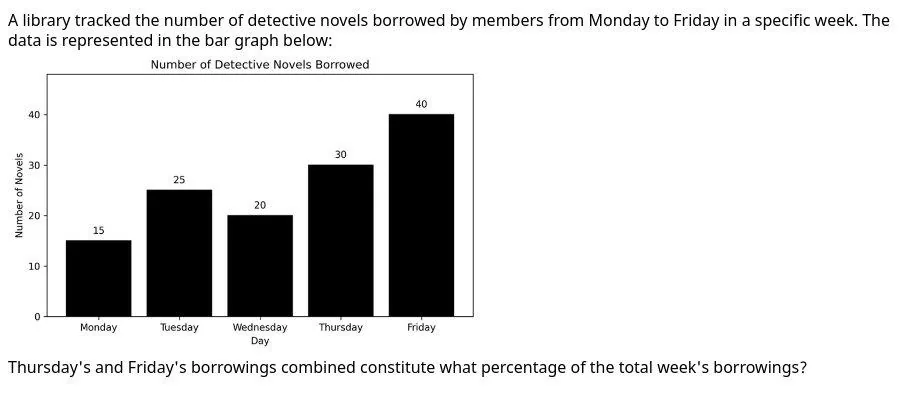
Bar values: Monday 15, Tuesday 25, Wednesday 20, Thursday 30, Friday 40. Total = 130. Thursday + Friday = 30 + 40 = 70. Percentage = 70/130 × 100 = 53.85% (rounded). Answer: option A. Option A.
figure
उत्तर: A
बार के मान: सोमवार 15, मंगलवार 25, बुधवार 20, गुरुवार 30, शुक्रवार 40। कुल = 130। गुरुवार + शुक्रवार = 30 + 40 = 70। प्रतिशत = 70/130 × 100 = 53.85% (पूर्णांकित)। उत्तर: विकल्प A।
🔗 Link
Q2009 Oct 2026 05:00 PM (Shift-3) · Q57Bar Graph Ratioeasy
figure
Answer: A
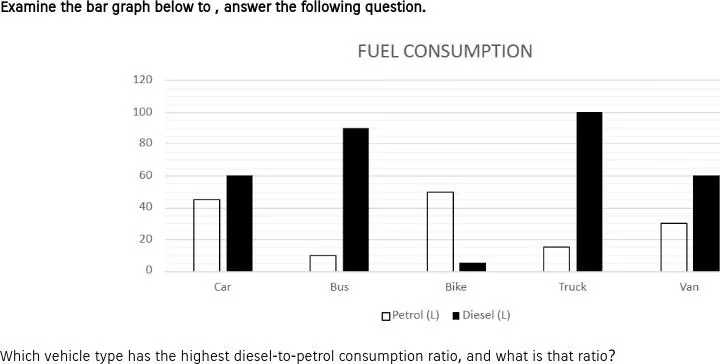
Diesel to petrol ratios from the graph: Bus 90:10 = 9:1, Truck 100:15 = 20:3, Car 60:45 = 4:3, Van 60:30 = 2:1. Bike is below 1 (5:50). The highest is Bus at 9:1, so option A is correct. Option A.
figure
उत्तर: A
ग्राफ से डीजल-पेट्रोल अनुपात: बस 90:10 = 9:1, ट्रक 100:15 = 20:3, कार 60:45 = 4:3, वैन 60:30 = 2:1 है। बाइक का अनुपात 1 से कम है (5:50)। सबसे अधिक अनुपात बस का 9:1 है, इसलिए विकल्प A सही है। विकल्प A।
🔗 Link
Q2115 Oct 2026 05:00 PM (Shift-3) · Q75Bar Graph Readingmoderate
figure
Answer: C
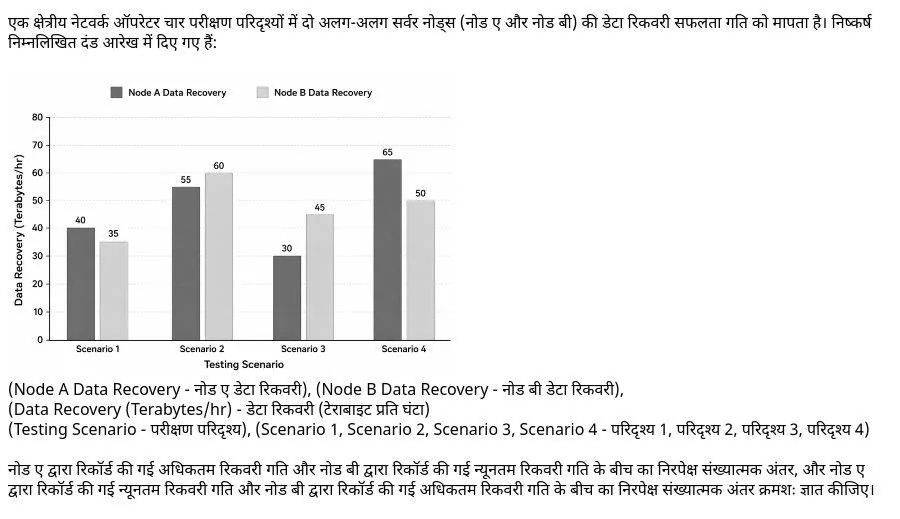
Node A: 40, 55, 30, 65. Node B: 35, 60, 45, 50. A node-instance fails if its speed is not strictly greater than 45. Failures: Node A 40 and 30; Node B 35 and 45 (45 is not strictly greater than 45). Total $=4$. Option C is correct. Option C.
figure
उत्तर: C
नोड ए: 40, 55, 30, 65। नोड बी: 35, 60, 45, 50। जिस नोड-इंस्टेंस की गति 45 से निरंतर अधिक नहीं है, वह विफल है। विफल: नोड ए में 40 और 30; नोड बी में 35 और 45 (45, 45 से अधिक नहीं है)। कुल $=4$। सही उत्तर विकल्प C है। विकल्प C।
🔗 Link
Q2214 Oct 2026 10:00 AM (Shift-1) · Q74Bar Graph: Maximum and Minimum Differencemoderate
figure
Answer: D
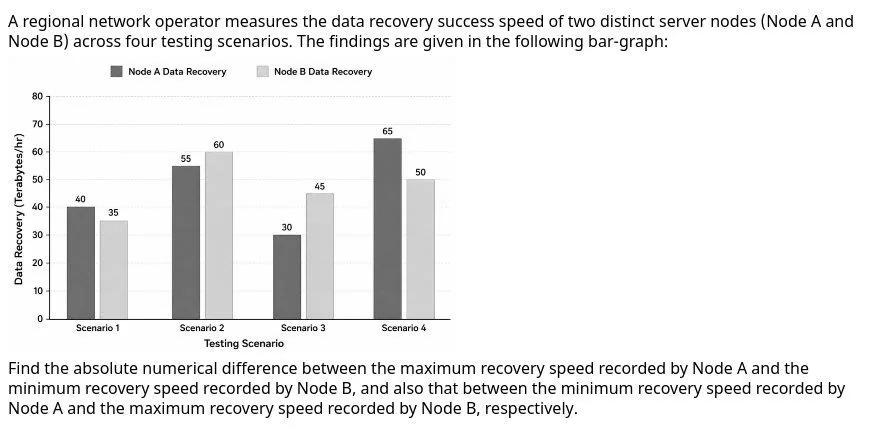
Node A readings: 40, 55, 30, 65, so max = 65 and min = 30. Node B readings: 35, 60, 45, 50, so max = 60 and min = 35. Max A - min B = 65 - 35 = 30. Min A - max B = |30 - 60| = 30. Both differences are 30, so. Option D.
figure
उत्तर: D
नोड ए के मान: 40, 55, 30, 65, अतः अधिकतम = 65 और न्यूनतम = 30। नोड बी के मान: 35, 60, 45, 50, अतः अधिकतम = 60 और न्यूनतम = 35। अधिकतम A − न्यूनतम B = 65 − 35 = 30। न्यूनतम A और अधिकतम B का अंतर = |30 − 60| = 30। दोनों अंतर 30 हैं, अतः सही विकल्प D है। विकल्प D।
🔗 Link
Q2313 Oct 2026 01:30 PM (Shift-2) · Q73Bar Graph: Total and Maximum Differenceeasy
figure
Answer: D
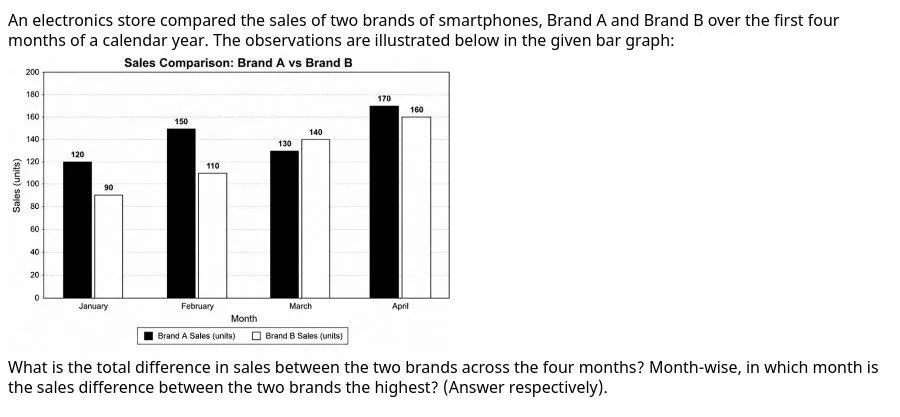
Brand A total $= 120+150+130+170 = 570$ units; Brand B total $= 90+110+140+160 = 500$ units. Total difference $= 570-500 = 70$ units. Month-wise differences (A minus B): January 30, February 40, March -10 (B higher), April 10. The largest difference is in February (40 units). Option D is correct. Option D.
figure
उत्तर: D
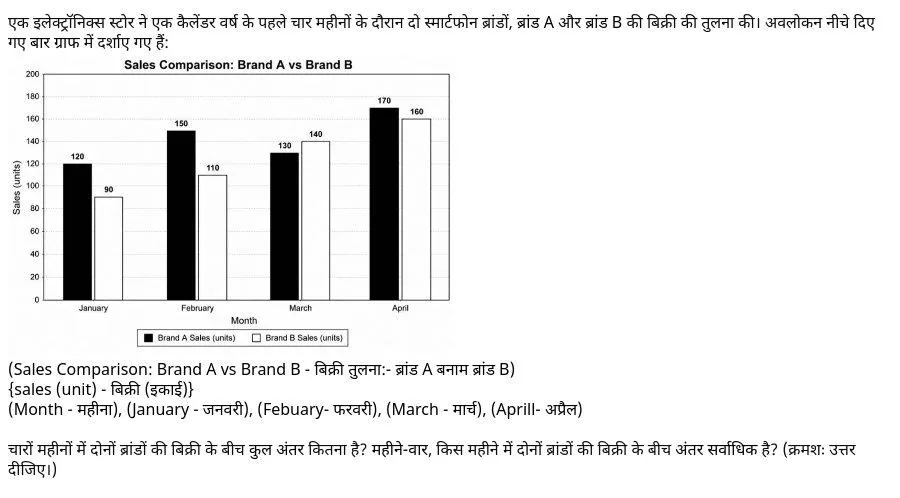
ब्रांड A की कुल बिक्री $= 120+150+130+170 = 570$ इकाई; ब्रांड B की कुल बिक्री $= 90+110+140+160 = 500$ इकाई। कुल अंतर $= 570-500 = 70$ इकाई। महीने-वार अंतर (A − B): जनवरी 30, फरवरी 40, मार्च −10 (B अधिक), अप्रैल 10। सर्वाधिक अंतर फरवरी में (40 इकाई) है। अतः विकल्प D सही है। विकल्प D।
🔗 Link
Q2407 Oct 2026 05:00 PM (Shift-3) · Q58Bar Graph: Wage Costmoderate
figure
Answer: A
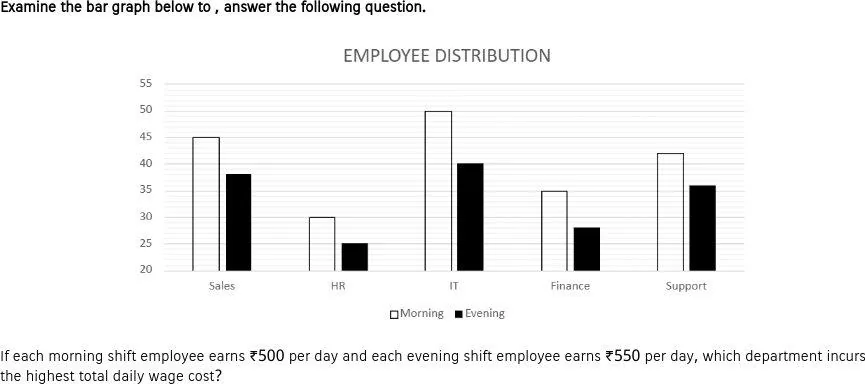
Daily wage cost = morning staff × 500 + evening staff × 550. Sales: 45×500 + 38×550 = 43,400. HR: 30×500 + 25×550 = 28,750. IT: 50×500 + 40×550 = 47,000. Finance: 35×500 + 28×550 = 32,900. Support: 42×500 + 36×550 = 40,800. IT is highest, which is option A. Option A.
figure
उत्तर: A
कुल दैनिक मजदूरी = सुबह के कर्मचारी × 500 + शाम के कर्मचारी × 550। सेल्स 43,400; HR 28,750; आईटी 47,000; फाइनेंस 32,900; सपोर्ट 40,800। सबसे अधिक लागत आईटी की है, जो विकल्प A है। विकल्प A।
🔗 Link
Q2524 Oct 2026 05:00 PM (Shift-3) · Q74Double Bar Graphmoderate
figure
Answer: D
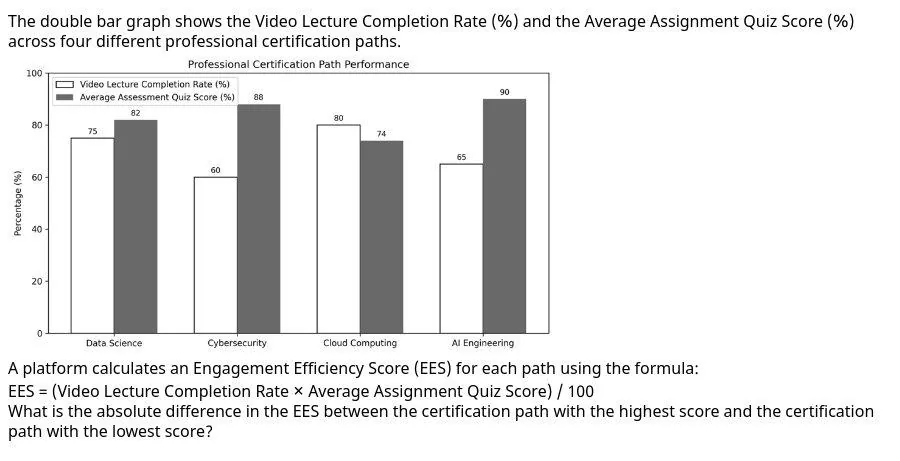
EES: Data Science 75×82/100=61.5; Cybersecurity 60×88/100=52.8; Cloud 80×74/100=59.2; AI 65×90/100=58.5. Difference 61.5−52.8=8.70. Option D.
figure
उत्तर: D
EES: डेटा साइंस 61.5, साइबर सिक्योरिटी 52.8, क्लाउड 59.2, AI 58.5। अंतर 8.70। विकल्प D।
🔗 Link
Q2601 Oct 2026 05:00 PM (Shift-3) · Q54Frequency Polygoneasy
figure
Answer: B
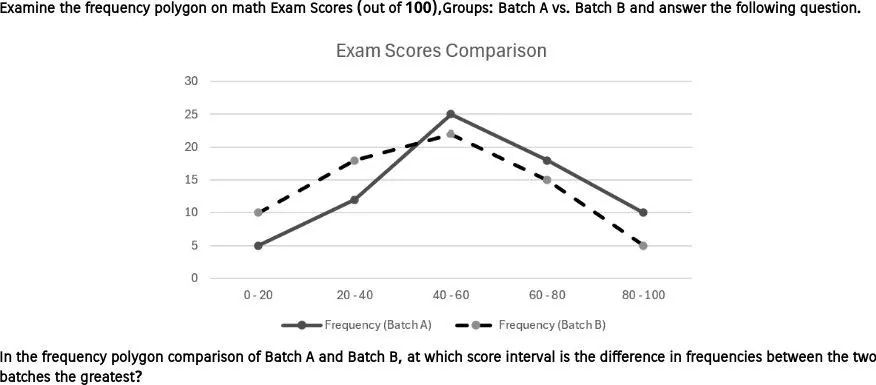
Read the graph. Batch A: 5, 12, 25, 18, 10. Batch B: 10, 18, 22, 15, 5. Differences: 0-20 gives 5, 20-40 gives 6, 40-60 gives 3, 60-80 gives 3, 80-100 gives 5. The greatest difference is 6 in the 20-40 interval, option B. Option B.
figure
उत्तर: B
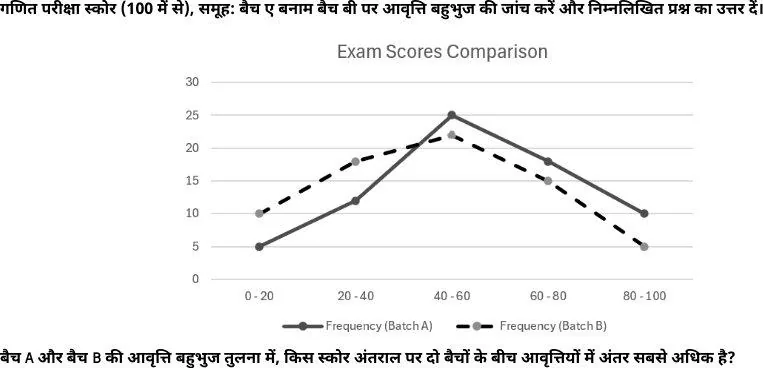
ग्राफ से पढ़े गए मान: बैच A के लिए 5, 12, 25, 18, 10 और बैच B के लिए 10, 18, 22, 15, 5 हैं। अंतर 0-20 पर 5, 20-40 पर 6, 40-60 पर 3, 60-80 पर 3 और 80-100 पर 5 है। सबसे बड़ा अंतर 20-40 अंतराल पर 6 है, जो विकल्प B है। विकल्प B।
🔗 Link
Q2706 Oct 2026 05:00 PM (Shift-3) · Q68Frequency Polygoneasy
figure
Answer: C
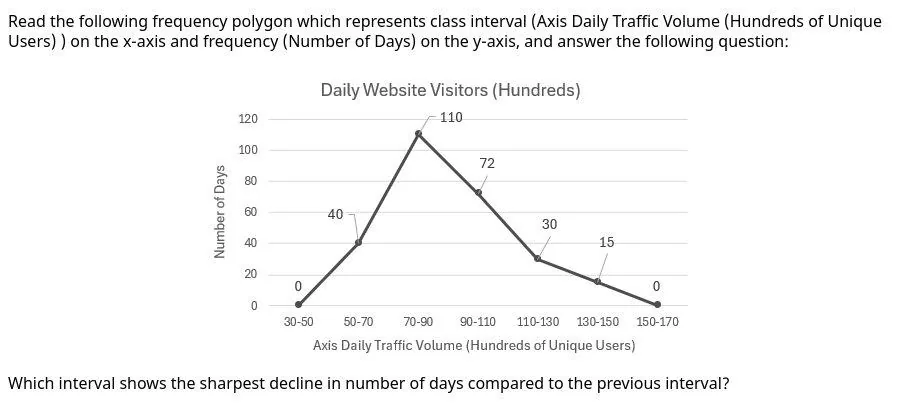
Day counts from the polygon: 30-50: 0, 50-70: 40, 70-90: 110, 90-110: 72, 110-130: 30, 130-150: 15, 150-170: 0. Declines between consecutive intervals are 38 (70-90 to 90-110), 42 (90-110 to 110-130), 15 and 15. The largest drop is 72 to 30, so the sharpest decline is at 90–110 to 110–130. Answer: C. Option C.
figure
उत्तर: C
बहुभुज से दिनों की संख्या: 30-50: 0, 50-70: 40, 70-90: 110, 90-110: 72, 110-130: 30, 130-150: 15, 150-170: 0। क्रमागत अंतरालों में गिरावट 38, 42, 15 और 15 है। सबसे बड़ी गिरावट 72 से 30 तक है, अतः सबसे तेज़ गिरावट 90–110 से 110–130 तक है। उत्तर: C। विकल्प C।
🔗 Link
Q2807 Oct 2026 05:00 PM (Shift-3) · Q54Frequency Polygonmoderate
figure
Answer: A
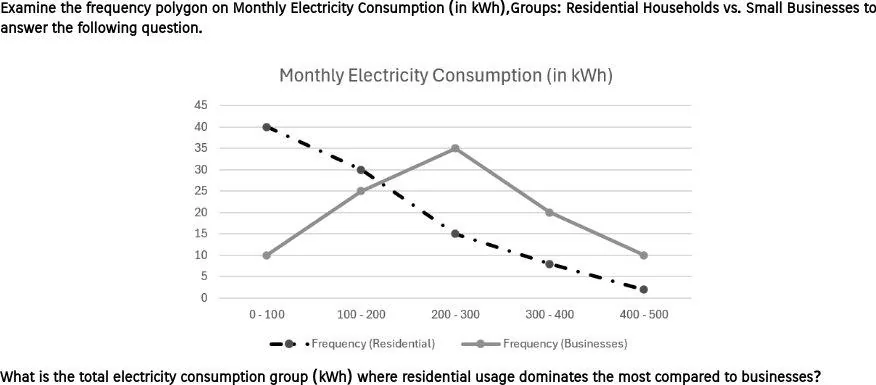
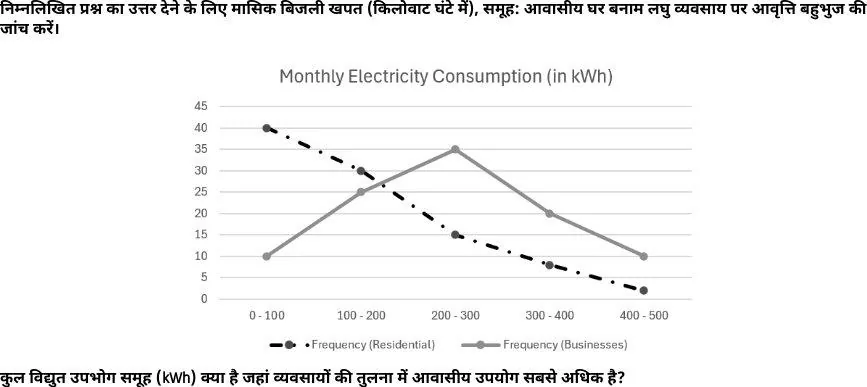
Read the chart. Residential vs businesses: 0-100 is 40 vs 10 (gap 30); 100-200 is 30 vs 25 (gap 5); 200-300 is 15 vs 35 (businesses higher); 300-400 is 8 vs 20; 400-500 is 2 vs 10. Residential usage dominates most in the 0-100 group, the largest positive gap, which is option A. Option A.
figure
उत्तर: A
चार्ट से मान पढ़ें। आवासीय बनाम व्यवसाय: 0-100 पर 40 बनाम 10 (अंतर 30); 100-200 पर 30 बनाम 25 (अंतर 5); 200-300 पर 15 बनाम 35 (व्यवसाय अधिक); 300-400 पर 8 बनाम 20; 400-500 पर 2 बनाम 10। आवासीय उपभोग का सबसे अधिक प्रभुत्व 0-100 समूह में है, जो विकल्प A है। विकल्प A।
🔗 Link
Q2909 Oct 2026 05:00 PM (Shift-3) · Q55Frequency Polygoneasy
figure
Answer: C
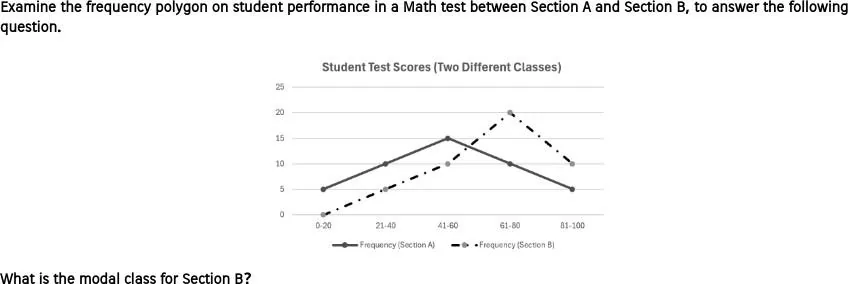
The modal class is the class with the highest frequency. For Section B (the dash-dot line), the frequencies are 0, 5, 10, 20 and 10 for the classes 0-20 to 81-100. The peak of 20 lies at the 61-80 class, so option C is correct. Option C.
figure
उत्तर: C
मॉडल वर्ग वह वर्ग है जिसकी आवृत्ति सबसे अधिक हो। खंड B (बिंदु-रेखा वाली रेखा) के लिए 0-20 से 81-100 वर्गों की आवृत्तियाँ 0, 5, 10, 20 और 10 हैं। सर्वाधिक आवृत्ति 20 वर्ग 61-80 पर है, इसलिए विकल्प C सही है। विकल्प C।
🔗 Link
Q3010 Oct 2026 01:30 PM (Shift-2) · Q51Frequency Polygoneasy
figure
Answer: B
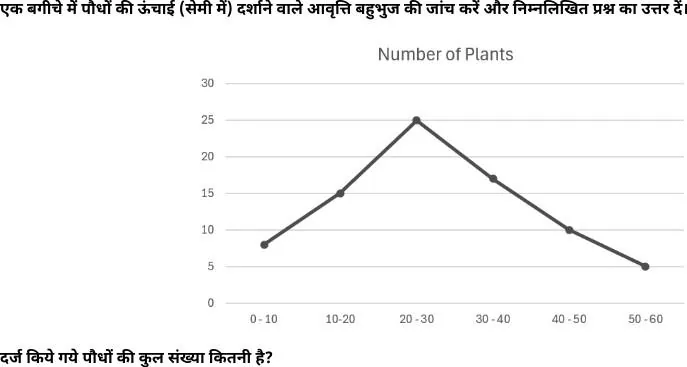
Read the frequencies from the polygon: 0-10 = 8, 10-20 = 15, 20-30 = 25, 30-40 = 17, 40-50 = 10, 50-60 = 5. Total = 8 + 15 + 25 + 17 + 10 + 5 = 80. Answer: B. Option B.
figure
उत्तर: B
बहुभुज से आवृत्तियाँ पढ़ें: 0-10 = 8, 10-20 = 15, 20-30 = 25, 30-40 = 17, 40-50 = 10, 50-60 = 5। कुल = 8 + 15 + 25 + 17 + 10 + 5 = 80। उत्तर: B। विकल्प B।
🔗 Link